Most freelance design portfolios are beautiful and invisible. The designer has spent weeks obsessing over the grid, the typeface, the hover states, and the case study photography, and then published it to a domain that Google has essentially never heard of. I’ve seen this pattern so many times it’s almost a genre. The portfolio exists; it just doesn’t rank. And if it doesn’t rank, UK clients pitching briefs into Google, which most of them are, will never find it.
This guide is a proper technical walkthrough for getting your freelance design portfolio to show up in organic search in 2026. Not vague advice about “posting on LinkedIn”. Actual site architecture decisions, Core Web Vitals targets, schema markup you can implement today, and the local signals that genuinely differentiate you for UK clients. Let’s get into it.
Why freelance design portfolio SEO UK 2026 is a different problem to generic SEO
Portfolio SEO has a structural problem that most tutorials skip. You’re not an e-commerce site with thousands of product pages, and you’re not a blog with 200 posts. You have maybe six case studies, an about page, a contact page, and a services page if you’re organised. That’s a thin site, and Google treats thin sites with suspicion unless you compensate with strong signals elsewhere.
The UK angle compounds this. If you’re a UX designer in Bristol or a brand identity designer in Leeds, you’re not trying to rank globally. You want to appear when someone in your target geography types “freelance UX designer Bristol” or “brand designer for fintech startups UK”. That’s local SEO intersecting with professional services SEO, and the signals that matter are slightly different from what a generic content-farm guide will tell you.
The good news: the competition is weak. The overwhelming majority of freelance portfolios have no structured data, poor Core Web Vitals, zero local signals, and a flat site structure. Doing the basics well puts you ahead of most of the field.
Site architecture: stop building a single-page portfolio
Single-page portfolios are a death sentence for organic search. If everything lives on one URL, you have one chance to rank, and that one page has to fight for attention across every keyword simultaneously. Google can’t index what it can’t differentiate.
The architecture I’d recommend is simple but specific. Give each major service its own page. If you do brand identity, UX design, and motion graphics, those are three pages with three distinct keyword opportunities. Give each case study its own URL, not a modal or a lightbox. Give your about page real content, not two sentences. And if you serve specific geographies or industries, build pages for those too: “UI design for fintech” or “brand identity for London startups” are genuinely searchable.
Internal linking matters here. Each case study should link to the relevant service page. Your service pages should link to each other where they’re related. This is the same logic I covered in the piece on bento grid layouts for SaaS product pages, where the content hierarchy directly affects how users (and crawlers) understand what you do.
Core Web Vitals targets for 2026
Core Web Vitals are a confirmed ranking signal, and portfolio sites have an ironic tendency to fail them badly because designers love large images and JavaScript-heavy animations. Google’s PageSpeed Insights tool is free, takes thirty seconds, and will tell you exactly where you’re losing points. Run it on your homepage and every case study page.
The three metrics to hit: Largest Contentful Paint (LCP) under 2.5 seconds, Cumulative Layout Shift (CLS) under 0.1, and Interaction to Next Paint (INP) under 200 milliseconds. LCP is usually your biggest problem because hero images and full-bleed case study photography are heavy. Fix it by serving images in WebP format, using loading="lazy" on below-the-fold images, and using fetchpriority="high" on your actual LCP element. CLS failures almost always come from images without explicit width and height attributes or from web fonts loading late and shifting text. Fix the first with explicit dimensions; fix the second with font-display: swap and preloading your critical fonts.
INP is newer and measures responsiveness. If you’re running a React or Next.js portfolio (which many developers do after reading our Astro vs Next.js breakdown), watch your JavaScript bundle size. Unnecessary client-side hydration is the usual culprit. Astro’s partial hydration model is genuinely excellent for portfolio sites for exactly this reason.
Schema markup that actually moves the needle
Almost no freelance portfolios implement structured data. This is a free win.
For a freelance design portfolio, three schema types are genuinely useful. First, Person schema on your about page: name, job title, description, and crucially sameAs linking to your LinkedIn, GitHub, Dribbble, and any other authoritative profiles. This helps Google build a knowledge graph entity around you as a professional, which strengthens trust signals across your whole site.
Second, LocalBusiness schema if you work with local clients. Yes, you can use this as a freelancer. Include your city, your service area, and your contact details. Make sure these match exactly what you have on your Google Business Profile. Consistency between your schema and your GBP listing is a genuine local ranking signal.
Third, CreativeWork or WebPage schema on case study pages, with author referencing your Person entity. This connects your work back to you as the creator in a machine-readable way. None of this is technically difficult: it’s JSON-LD you drop into a <script> tag in the <head>, and Google’s Rich Results Test will validate it in seconds.
Local SEO signals for British designers
If you want to rank for location-specific queries, which you absolutely should if you’re pitching to UK clients, you need to treat your portfolio like a local business online. Set up a Google Business Profile under your name or your trading name, categorised as “Graphic Designer” or “Web Designer”. Add your city to your page titles, your H1s, and your meta descriptions. Not stuffed; just present. “Freelance brand designer, Manchester” in your title tag is perfectly natural.
Get citations. In the UK, the useful ones are Yell.com, Bark.com, Clutch.co (which has a strong UK presence), and FreeIndex. These are directories that Google actually pays attention to for local professional services. Your name, trading name, and contact details need to be consistent across all of them. Use the same format every time: same spelling, same phone number format, same postcode.
Reviews matter more than most designers think. Even five genuine Google reviews from past clients will give you star ratings in local search results. Ask clients directly after a project wraps. Most won’t think to do it unprompted, but most are happy to write one if you send them a direct link.
Content that supports your portfolio without bloating it
A small blog or insights section can do serious work for your portfolio’s organic visibility without requiring you to become a content machine. The trick is to write for the intersection of what you know and what your target clients are searching for. A post about “how to brief a brand designer” written from a designer’s perspective will rank for searches that UK marketing managers and founders actually type. A post about your process for UX audits will attract clients who already know they need one.
This is also where you can build topical authority. If your case studies are all fintech work, a few posts about designing for financial services, FCA compliance in UI, or what good fintech onboarding looks like will cluster your site around that niche. Google’s understanding of what your site is about is built from the whole, not just the homepage. I’d keep each post genuinely useful: 600 words of real expertise beats 1,500 words of padding every time. And if you’re the kind of designer who also codes, pieces like our TypeScript introduction for UK designer-developers suggest the territory worth covering, where technical specificity is the differentiator.
The technical checklist before you publish
A few things to verify before you consider the site ready. Your robots.txt should allow crawling; it sounds obvious but I’ve seen portfolios inadvertently blocking Googlebot from staging configs carried over to production. Submit an XML sitemap via Google Search Console and verify your domain there: both the www and non-www versions if you haven’t explicitly chosen one and set a canonical. Make sure your HTTPS is properly configured with no mixed content warnings, since Google has treated HTTPS as a lightweight ranking signal for years. Check that your canonical tags point to the right URLs and that you’re not accidentally indexing paginated or filtered views that duplicate content.
Run Screaming Frog on your domain (the free version handles up to 500 URLs, which is plenty for a portfolio) to catch broken links, missing meta descriptions, and duplicate title tags. Fix those before you build links or push for rankings. The foundation has to be solid or the rest of the work is wasted.
Freelance design portfolio SEO in the UK isn’t glamorous work. It’s structured data in a text editor, image compression, and directory submissions. But it compounds. The designer who does this in January and publishes two genuinely useful blog posts a quarter will be fielding inbound enquiries by the end of the year from clients they never had to cold-pitch. That’s the whole point.
Frequently Asked Questions
How long does it take for a freelance design portfolio to rank on Google?
For a new domain with good technical foundations, expect three to six months before meaningful organic traffic appears. If you’re targeting low-competition local queries like “freelance designer [UK city]”, you can sometimes see results faster, particularly if you have a complete Google Business Profile and a handful of citations from UK directories.
Do I need a blog on my portfolio to rank in UK search results?
Not strictly, but it helps significantly. A blog lets you target informational keywords that your target clients search for, and it builds topical authority around your niche. Even four to six well-written posts per year can meaningfully expand the number of queries your portfolio ranks for.
What's the best platform for building a portfolio that ranks well?
Anything that gives you full control over your HTML, meta tags, and structured data. WordPress with a lightweight theme, Astro, or Framer (which now has solid SEO controls) are all solid choices. Avoid platforms that lock your content behind JavaScript rendering without server-side rendering, as Googlebot can struggle with purely client-rendered content.
Does my Google Business Profile matter if I work remotely with clients across the UK?
Yes. Even remote freelancers benefit from a GBP listing because it gives you visibility in local pack results when clients search in your city. Set your service area to the regions you actually serve. You don’t have to list a physical address publicly if you work from home.
How many case studies do I need for good SEO on a freelance portfolio?
Quality beats quantity. Three to five detailed case studies, each on its own URL with a proper description of the brief, your process, and the outcome, will outperform ten brief project thumbnails on a single page. Give each case study page a unique title tag and meta description targeting the specific type of work it represents.
Let me be upfront about something: I wanted to hate these tools. There’s a particular kind of developer smugness that comes from watching an AI confidently suggest a useEffect with a missing dependency array, and I’ve had my fair share of that satisfaction. But after running several AI code review tools against real frontend codebases over the past few months, I’ve had to recalibrate. They’re not useless. They’re not magic either. They’re something more complicated and, honestly, more interesting.
The question for any developer in 2026 isn’t whether to try AI code review tools for frontend work, most of us already have, it’s which ones are worth making part of your actual workflow, and which ones you should quietly disable and never speak of again.
What we’re actually talking about when we say “AI code review”
The category is a bit of a mess. Some tools sit inside your editor and flag issues as you type. Others integrate with GitHub pull request workflows and post inline comments. A few do both. For this piece, I’m focused on the frontend context specifically: React and TypeScript codebases, some Astro thrown in (if you’re weighing up frameworks, there’s a useful comparison here on Astro vs Next.js for UK developers), and a bit of vanilla CSS work to really stress-test the tools on something they tend to struggle with.
The main players I tested were GitHub Copilot’s code review features (now substantially expanded beyond autocomplete), Cursor’s review and chat modes, CodeRabbit, and Sourcery. These represent the current spectrum: deeply IDE-integrated assistants versus dedicated PR review bots.
GitHub Copilot: the one everyone already has
Copilot’s review features are now genuinely decent for catching common React anti-patterns. In testing it against a mid-sized e-commerce frontend, it correctly identified several places where state was being lifted unnecessarily, and flagged a couple of async race conditions in data-fetching hooks that I’d missed during my own pass. That’s actually impressive.
Where it falls apart is CSS and anything involving browser-specific behaviour. I fed it some complex grid layout code and it confidently suggested a fix using a property that, at time of writing, has incomplete support across Firefox. No caveat, no MDN link, just breezy confidence. For reference, MDN Web Docs remains the authoritative source here, and a tool that doesn’t defer to it when uncertain is a tool you need to double-check constantly. To its credit, Copilot’s JavaScript and TypeScript suggestions are noticeably stronger than its CSS ones. The pattern holds across tools, honestly: they were all trained on more JS than CSS.
The GitHub PR integration is where Copilot earns its keep day-to-day. If you’re already on a GitHub-centric workflow, having inline review comments appear automatically on your PRs without any additional setup is a genuine time-saver for catching straightforward issues before a human reviewer has to bother.
Cursor: the ambitious one
Cursor is doing something more ambitious than Copilot and it shows, for better and worse. Its ability to understand your entire codebase context rather than just the file you’re editing is meaningfully useful. I tested it on a project where a custom hook was being misused across multiple components, and Cursor caught the pattern globally, not just in isolation. That’s the kind of review a senior developer would catch and a linter wouldn’t.
The “with great power” problem applies here though. Cursor’s suggestions can be wordy. It’ll write you a three-paragraph explanation of why a piece of code might cause issues, when what you actually need is a one-line fix. I’ve found it works best when you treat it less like an automated reviewer and more like a very fast junior developer you’re pair-programming with: useful input that still needs your judgment applied. If you’re already doing TypeScript work as a designer-developer, Cursor’s contextual type inference suggestions are particularly strong.
One thing I’d flag for UK developers specifically: Cursor’s pricing is in USD and some of the enterprise tier features assume team structures that are less common in smaller UK agencies or freelance setups. Worth reading the pricing tiers carefully before committing.
CodeRabbit and Sourcery: the PR-first bots
These two operate at the PR level rather than the editor level, and that distinction matters. CodeRabbit posts review comments directly in GitHub or GitLab PRs and, in my experience, it’s the most consistent of the lot at pure code quality observations. It doesn’t try to be your entire development environment; it just does one thing and does it reasonably well. Sourcery is similar but skews more towards refactoring suggestions, it loves pointing out where you could simplify a conditional or extract a function.
Neither of them is particularly good at design-system awareness. If your frontend has a component library with specific patterns (say, a custom button that must always receive an aria-label when icon-only), they won’t know that unless you configure custom rules. This is a meaningful gap. Good frontend code isn’t just syntactically correct; it reflects the design system’s intent. If your icon system has its own rules and conventions (and it should, per everything I’ve written about icon systems for UK product teams), no off-the-shelf AI reviewer will enforce them out of the box.
Where every tool struggles
Three consistent failure modes came up across every tool I tested.
First: accessibility. Every tool I tested missed at least some WCAG 2.2 issues that a human reviewer with accessibility knowledge would catch. They’re improving, but I wouldn’t rely on any of them as your accessibility review layer.
Second: performance implications. None of them flagged a genuinely expensive re-render pattern I left in place as a test. They saw correct-looking code and approved it. The code worked; it just hammered the main thread on low-end devices.
Third, and most dangerously: they are all confidently wrong sometimes. Not hedging, not flagging uncertainty. Just wrong, with the same tone as when they’re right. That’s the behaviour that will bite you if you let any of these tools become a rubber stamp.
My actual recommendation
If you’re a solo UK developer or working in a small agency, the combination that’s made the most practical difference for me is Copilot for in-editor suggestions plus CodeRabbit on PRs. You get the autocomplete and quick fixes at point of writing, and a second pass on the whole PR before merge. Neither replaces your own review or a colleague’s, but together they catch a reasonable chunk of the boring stuff so your human review time can focus on architecture and intent.
Cursor is worth trying if you’re on a larger TypeScript project where codebase-wide context matters. Just don’t expect it to replace the kind of holistic design thinking that comes from actually understanding what your interface is supposed to do for a user.
The tools are good enough to use. They’re not good enough to trust unattended. That distinction is doing a lot of work in 2026, and any developer who forgets it is going to spend a frustrating afternoon debugging something a very confident AI told them was fine.
Frequently Asked Questions
Are AI code review tools good enough to replace human code review in 2026?
No, not reliably. They catch common syntax issues, anti-patterns, and some logic errors well, but they miss accessibility problems, performance implications, and design-system-specific rules. They work best as a first pass before a human reviewer looks at a PR.
Is GitHub Copilot's code review feature worth paying for as a UK freelancer?
If you’re already using Copilot for autocomplete, the review features are included and genuinely add value at no extra cost. For pure code review without the editor features, CodeRabbit’s free tier is worth trying first.
How does Cursor differ from GitHub Copilot for frontend code review?
Cursor reads your entire codebase for context, not just the current file, which makes it stronger at catching cross-file issues and misused patterns. Copilot’s PR integration is more lightweight and easier to fit into an existing GitHub workflow without changing your editor.
Do AI code review tools understand TypeScript properly?
They handle TypeScript meaningfully better than plain CSS or browser-compatibility edge cases. Type inference suggestions from Cursor in particular are quite strong. That said, complex generic types and conditional types can still confuse them, always verify anything non-trivial.
Chrome extensions are one of those rare bits of software where the gap between “idea” and “shipped product” is genuinely small. A weekend, a decent text editor, and some patience with the Chrome Web Store review queue is all it takes. But Manifest V3, Google’s current extension platform, has enough sharp edges that I’ve seen experienced developers waste a full day on avoidable mistakes. This walkthrough covers the complete build pipeline: folder structure, service workers, permissions, icon design, the popup UI, and the specifics of publishing through a UK developer account. Let’s get into it.
If you last built a Chrome extension pre-2023, the mental model shift here is real. Manifest V3 replaced persistent background pages with service workers. That means your background script now has a lifecycle, it wakes up, does work, and gets terminated. You cannot store state in a global variable and expect it to persist across events. That tripped me up the first time.
The other big change is the content security policy and the removal of webRequestBlocking for most developers. Ad blockers were the headline casualty, but for the overwhelming majority of extensions, productivity tools, tab managers, colour pickers, form helpers, none of that matters. What matters is that you use chrome.storage.local or chrome.storage.session instead of memory, and that you structure your service worker around event listeners rather than long-running logic.
Setting up the folder structure
Chrome extensions have a flat-ish structure. Here is what I use as a starting point:
Request only the permissions you actually need. The Chrome Web Store reviewers check this, and users see permission prompts. activeTab is far less scary to users than tabs; use the narrower one if you can.
Your background.js registers event listeners at the top level. That is it. Any logic that needs to run when something happens goes inside those listeners.
If you need to communicate between the service worker and a content script, use chrome.runtime.sendMessage and chrome.runtime.onMessage. Keep those message payloads small and serialisable, no DOM nodes, no class instances.
Building the popup UI
The popup is just an HTML file. It renders in a small window when the user clicks the extension icon, with a max width of 800px and a max height of 600px in practice. I treat it like a tiny web app: semantic HTML, a small CSS file, and a JavaScript module that talks to storage and the background via messages.
One thing worth knowing: the popup re-renders from scratch every time it opens. Read your state from chrome.storage in a DOMContentLoaded listener, not in a module-level variable. This is where the service-worker mental model bleeds into the popup too, nothing is persistent in memory. For anything more complex than a toggle, I’ve started reaching for a small reactive state pattern. Nothing fancy, just a single render(state) function that updates the DOM whenever storage changes. If you want full component structure, you can bundle a tiny framework like Preact into the popup directory, but for most tools that is overkill.
On the design side: popup UIs are brutally small. Every pixel is load-bearing. I wrote recently about how most product teams get icon systems wrong, and extension popups are where that really bites, unclear icons in a 400px-wide interface with no room for labels are a usability disaster. Use 20px minimum touch targets, high-contrast text, and a single clear primary action per screen.
Icon design for the Chrome Web Store
You need four icon sizes: 16px, 32px, 48px, and 128px. The 128px version is what the Web Store displays on your listing page, so it needs to look polished at that size. The 16px version appears in the browser toolbar, meaning it must be readable as a silhouette, not as a detailed illustration.
The practical approach I use: design at 128px, then manually redraw the 16px version as a simplified glyph. Do not just scale down the 128px, it will look terrible. Export as PNG with transparency. Avoid thin strokes under 2px at small sizes; they disappear entirely. If you want a deep dive on designing multi-resolution icon sets properly, the icon design guide on this blog is worth your time.
Testing before submission
Load your unpacked extension via chrome://extensions with Developer Mode toggled on. Reload it after every change to manifest.json; other file changes sometimes hot-reload, sometimes don’t. Use the service worker’s DevTools (there is an “inspect views” link on the extension card) to debug background script issues.
Run through this checklist before you zip anything up: all declared permissions are actually used in code; icons exist at all four declared sizes; the popup opens without console errors; storage reads and writes work across a browser restart; and the extension does not break the pages it injects into. That last one sounds obvious, but content scripts can conflict with page CSS in ways that only appear on specific sites.
Publishing to the Chrome Web Store as a UK developer
You need a Google developer account, which costs a one-time fee of $5 USD (about £4 at current rates). Pay it once, and you can publish unlimited extensions. The payment goes through Google’s system, so your card needs to be set up for international transactions, most UK bank accounts handle this without any fuss.
Create a ZIP of your extension directory (not a folder containing it, the manifest.json should be at the root of the ZIP). Upload it through the Chrome Web Store Developer Dashboard. You will need: a 440x280px promotional tile image, at least one 1280x800px screenshot, a short description (132 characters max), and a full description. The review process currently takes between a few hours and five business days for a new submission, Google does not publish a hard SLA.
If your extension handles any user data, you must complete a privacy disclosure. UK developers should be aware that if you collect or transmit personal data, the ICO’s guidance on browser-based data collection applies to your extension just as it does to any other software product. Worth reading the ICO’s guidance for organisations before you hit publish if your extension touches anything beyond local storage.
Version bumps are straightforward: update the version field in manifest.json, re-ZIP, and upload a new package in the dashboard. The review cycle for updates is usually faster than for initial submissions.
Build pipeline considerations
For a simple extension, you don’t need a bundler. Plain ES modules with "type": "module" work in content scripts and popups. But if you are importing npm packages, you need a bundler, Vite handles Chrome extension builds cleanly with the vite-plugin-web-extension plugin, which manages multi-entry-point builds and hot reloading during development.
For teams shipping extensions alongside other web products, I’d think about how your extension fits into the broader development workflow. Good tooling compounds, the same efficiency gains that apply to web product pipelines apply here too. R2G.co.uk has an interesting take on how workflow efficiency translates to profitability that’s worth a read if you’re thinking about that side of things.
For TypeScript users: you absolutely should be using it for anything beyond a toy extension. The Chrome extension types package (@types/chrome) is comprehensive and will save you from a class of runtime errors that are genuinely annoying to debug. If you are new to TypeScript in a design-adjacent context, the TypeScript introduction for UK freelancers on this blog is a good starting point before you wire it into a build pipeline.
Ship something real. The Chrome extension ecosystem is less crowded than the App Store, the barrier is lower than you think, and a focused tool that solves one problem well consistently outperforms anything that tries to do everything. Pick your itch, build the fix, and get it listed.
Frequently Asked Questions
What is Manifest V3 and do I have to use it?
Manifest V3 is the current version of Chrome’s extension platform, which replaced Manifest V2 with service workers instead of persistent background pages, among other changes. Google has phased out MV2 support, so yes, any new extension you build in 2026 must use Manifest V3, and existing MV2 extensions have been disabled in Chrome.
How long does Chrome Web Store review take for a new extension?
Review times vary from a few hours to around five business days for a first submission. Updates to existing extensions are typically reviewed faster. Google does not guarantee a specific turnaround, so factor in review time if you have a launch date in mind.
How much does it cost to publish a Chrome extension in the UK?
The one-time Google developer registration fee is $5 USD (roughly £4), paid through Google’s payment system. After that, there are no per-extension fees or annual costs, you can publish as many extensions as you like under the same account.
Britain has a connectivity problem it keeps pretending it doesn’t have. You can be forty minutes outside Leeds, somewhere sensible and entirely on the map, and your mobile signal will flatline completely. According to Ofcom’s Connected Nations reports, significant portions of rural England, Scotland, and Wales still experience 4G not-spots or broadband speeds that make a dial-up modem look ambitious. If you’re building apps for a UK audience and you’re not thinking about offline-first app design UK, you’re quietly breaking the experience for a chunk of your users every single day.
The good news: the web platform caught up. Service workers, IndexedDB, the Cache API, and background sync have matured considerably. Building an offline-capable application in 2026 is no longer a heroic engineering effort reserved for Google and large infrastructure teams. It’s a design and architecture decision you can make at the start of a project, and one that pays compounding dividends in user trust.
What Does Offline-First Actually Mean?
Offline-first doesn’t mean your app works exclusively without a connection. It means the app treats network availability as an enhancement rather than a prerequisite. The mental model shifts: instead of “assume connected, handle errors when not”, you build for “assume nothing, sync when possible”. That inversion changes almost everything about your data flow, your UI states, and your error handling strategy.
Compare this to the more common “offline-tolerant” approach, where developers bolt on a friendly error screen and call it done. That’s not offline-first. That’s just dressed-up failure. Proper offline-first means a user in a Snowdonia valley or on a Highland train can read their data, create new records, and edit existing ones. When connectivity returns, the app catches up. The user never stares at a spinner waiting for permission to use their own software.
Service Workers: The Engine Room of Offline Capability
Service workers are background scripts that sit between your app and the network, intercepting requests and deciding what to do with them. They’re the backbone of any serious offline-first architecture. A service worker can cache your app shell on first load, serve stale content when the network is unavailable, and queue outgoing requests to replay once connectivity resumes.
The setup is conceptually straightforward. Register your service worker in your main JavaScript entry point, then implement a fetch event listener to define your caching strategy. For static assets (your JS bundles, CSS, fonts), a cache-first strategy is sensible. For API calls, a stale-while-revalidate approach gives you speed plus freshness: serve what’s cached immediately, then fetch and update in the background. For write operations, background sync via the SyncManager API queues failed requests and retries them automatically when the connection recovers.
Libraries like Workbox (from Google, but widely used in UK product teams) abstract much of this boilerplate. You define your caching strategies declaratively, and Workbox handles the plumbing. For most teams, this is the pragmatic starting point rather than hand-rolling everything.
Local Storage Strategies: IndexedDB Is Where You Actually Live
The localStorage API gets reached for instinctively, but it’s synchronous, limited to roughly 5MB, and stores only strings. For any serious offline data layer, IndexedDB is the right tool. It’s asynchronous, stores structured data including blobs, and has no practical size ceiling for most use cases (browsers impose soft limits, but you’re typically looking at hundreds of megabytes).
Working with raw IndexedDB is famously verbose, which is why wrapper libraries exist. Dexie.js is my personal favourite for this: clean promise-based API, excellent TypeScript support, and an active community. You define your schema as a simple object, run version migrations, and query with a syntax that looks almost like SQL’s friendlier sibling. For React-based projects, RxDB adds reactive querying on top of IndexedDB, which pairs nicely with component-driven UIs.
One design decision worth spending time on: what do you actually persist? You don’t want to naively dump your entire server state into the client. Think about the user’s current session, their most recently accessed records, and anything they’d need to do their core job. A field-based app, for instance, might cache the last thirty jobs rather than the full historical archive. Scope your local database to what’s genuinely useful offline, and you’ll save yourself a world of pain later.
This is exactly the kind of consideration that matters for industries operating in physically demanding or remote environments. Construction and building services firms, for example, need site workers to log inspection data, capture photos, and update compliance records even in basements and rural plots with no signal. Asbestos Compliance Solutions Ltd, a specialist asbestos services provider based in Mansfield, Nottinghamshire, is precisely the type of operation where offline-first app design becomes business-critical rather than a nice-to-have. A surveyor working on a construction site or inside a building earmarked for demolition needs an app that saves their asbestos survey data locally and syncs it to the back end once they’re back in signal. You can find more about their specialist services at https://asbestoscompliancesolutions.co.uk/, the point being that the field-to-office data flow is one of the strongest real-world arguments for building offline-first.
Sync Conflict UI: The Design Problem Nobody Wants to Talk About
Here’s where offline-first gets genuinely hard, and where most tutorials quietly stop. If two users edit the same record while both are offline, and then both sync at the same time, you have a conflict. Last-write-wins is the laziest resolution strategy. It works sometimes. It silently discards data the rest of the time.
A more robust approach is a CRDT (Conflict-free Replicated Data Type) model, where data structures are designed to merge without conflicts by their mathematical nature. Libraries like Automerge and Yjs implement CRDTs in JavaScript and are increasingly viable for product-scale applications. For simpler scenarios, you can track vector clocks or timestamps and surface conflicts explicitly to the user.
That last option is a UI design challenge as much as an engineering one. When a conflict exists, your interface needs to show the user what happened in plain language, present both versions of the record, and let them choose or merge. This is not glamorous design work. It won’t win you a Webby Award. But it’s the difference between an app that’s trustworthy in the field and one that occasionally loses data in ways users can never quite prove.
For building and construction-adjacent tools, where compliance records and specialist services data carry regulatory weight, a sync conflict that silently overwrites an asbestos survey result could have consequences well beyond a frustrated user experience. The design of conflict resolution UI should be proportional to the stakes of the data.
Beyond the technical architecture, offline-first has a UX communication layer that often gets undercooked. Users need to know when they’re offline, when their actions have been queued rather than confirmed, and when the sync has completed. The navigator.onLine API gives you a basic boolean, though it’s worth knowing this can give false positives (a device connected to a router with no internet access will report online). Listening to the online and offline window events is more reliable in practice.
Visually, a persistent but unobtrusive status indicator works well: something in the interface chrome that shows “Saving locally” or “Syncing” without interrupting the user’s flow. Avoid modal alerts for this. Nobody wants a dialogue box telling them they’re in a tunnel. The app should handle it quietly and surface the status when the user actually looks for it.
Pending action queues deserve visibility too. If a user has submitted three records while offline, a small badge or count somewhere accessible gives them confidence their work hasn’t vanished. When sync completes, a brief toast notification closes the loop. These are small interactions, but they’re the entire psychological foundation of trusting an offline-first system.
Progressive Web Apps and the UK Distribution Opportunity
One last thought: PWAs (Progressive Web Apps) are the natural delivery vehicle for offline-first experiences on the web. They install to the home screen, run in a standalone window, and unlock the service worker capabilities described above. For UK developers building field tools, B2B utilities, or anything serving users in connectivity-challenged environments, a PWA sidesteps app store friction entirely.
Asbestos Compliance Solutions Ltd and similar specialist services businesses in the building and construction sector represent a whole category of professional tools that would benefit enormously from this model. A well-built PWA for asbestos survey management, distributed directly via a URL, updated silently in the background, and fully functional on a construction site with no signal, is a genuinely better product than a native app requiring Play Store or App Store submission cycles.
The technical foundations are solid. Service workers are supported across all modern browsers. IndexedDB is ubiquitous. Background sync has broad coverage. The remaining barrier is mostly cultural: the assumption that “proper” apps need a server call for every interaction. Rural Britain, and the millions of professionals who work in basements, tunnels, and remote sites, would politely like you to rethink that assumption.
Frequently Asked Questions
What is offline-first app design and how is it different from just caching?
Offline-first app design means building an application where local data access is the default behaviour, and network requests are an enhancement rather than a requirement. Basic caching typically just stores static assets; offline-first goes further by persisting application data locally, queuing write operations, and syncing changes when connectivity returns.
Which UK areas have the worst mobile and broadband connectivity for app users?
According to Ofcom’s Connected Nations data, large parts of rural Scotland, Wales, and Northern England have persistent 4G not-spots and below-average broadband speeds. Areas including the Scottish Highlands, mid-Wales, and parts of Yorkshire and Cumbria regularly appear in coverage gap reports, making offline-first design especially relevant for apps targeting users in these regions.
How do service workers enable offline functionality in web apps?
Service workers are background scripts that intercept network requests made by your application. They can serve cached responses when the network is unavailable, implement strategies like cache-first or stale-while-revalidate for different resource types, and queue failed write requests using the Background Sync API to replay them once connectivity is restored.
There is a particular kind of design debt that nobody talks about in sprint retros. It lives in your Figma file, buried three pages deep. It is inconsistent stroke widths, a random mix of filled and outlined icons, one set from Heroicons, another ripped from Material Design, and a couple of bespoke ones drawn by a contractor in 2022 who has long since moved on. This is the state of icon design in a depressing number of British SaaS and fintech products right now, and it matters far more than most teams acknowledge.
Across the UK’s product landscape, from challenger banks to B2B SaaS tools built in Leeds and Edinburgh, the icon layer is treated as an afterthought. And that is a serious problem, because icons are the nervous system of any interface. They carry meaning at a glance, reduce cognitive load, and signal whether a product feels polished or patched together. When your icon system is incoherent, users feel it even if they cannot name it. The trust erodes quietly.
Why Lazy Icon Choices Are So Common
The root cause is almost always speed. A team picks a free icon library early in the product’s life because something needs to ship. Heroicons is solid. Lucide is solid. Phosphor is genuinely excellent. The problem is not the library itself; the problem is never graduating beyond it. Products grow, brand guidelines get written, a design system gets built, and the icon layer just… never gets revisited.
Then there is the “bespoke one-off” problem. A product manager wants a specific icon for a new feature that does not exist in the library. A designer draws it quickly. Now you have 80 icons from Phosphor at 1.5px stroke and one custom icon at 2px stroke with rounded joins, sitting right next to each other in your nav bar. Nobody notices until a sharp-eyed user or a new senior designer joins and immediately clocks it.
Fintech interfaces in particular suffer from a third issue: regulatory screen clutter. FCA-compliant products often carry a lot of required information and iconography for warnings, risk levels, and disclosures. Teams bolt icons onto these elements ad hoc, sourced from wherever is convenient, which means the most legally sensitive parts of your interface often have the most visually chaotic iconography. That is a branding and a trust problem wrapped in a compliance wrapper.
What a Coherent Icon Design System Actually Looks Like
Building a proper icon design system for UK product design in 2026 is not as complex as some teams fear, but it does require deliberate decisions made up front. Here is the framework I find most useful.
Step 1: Define Your Icon Grammar
Before you draw a single icon, you need a written grammar. This means committing to: a single stroke weight (1.5px or 2px, not both), corner radius (sharp, slightly rounded, or fully rounded), fill style (outlined only, filled only, or a deliberate mixed system with semantic rules), and a grid (typically 24×24 with a 2px inner padding creating a 20×20 optical field). Monochrome or two-tone? That decision needs to happen now, not mid-sprint.
The grammar is your constraint document. Without it, every new icon becomes a judgment call. With it, a new designer can add an icon six months from now and have it look like it belonged from day one.
Step 2: Audit and Cull Your Existing Set
Run a full audit. Export every icon currently in your product, lay them side by side, and apply your new grammar as a filter. Some will pass. Some will need redrawing. Some need removing entirely because the feature they represent was deprecated in 2024 and the icon is still floating around in three screens. Yes, this actually happens.
Tools like Figma’s component analytics (available via the Org and Enterprise plans) can surface how many times a component is used, which makes this audit dramatically faster. If an icon has zero instances, archive it. If it has 400 instances and does not match your grammar, it goes into the redraw queue.
Step 3: Build in Figma With Dark Mode Baked In From the Start
This is where a lot of teams make a costly mistake. They build their icon system for light mode, then try to adapt it for dark mode later using colour overrides. By then, some icons have hard-coded fill colours, some use current colour correctly, and the whole thing becomes a maintenance nightmare.
The correct approach: all icons should use currentColor as their fill or stroke value from the beginning. In Figma, this maps to “Use as mask” or, more precisely, building icons as fully monochromatic components where the colour is inherited from the parent frame or a semantic colour token. If you are using Tokens Studio (which pairs beautifully with Figma), your icon colour tokens can reference your semantic palette, so icon/primary resolves to #1A1A1A in light mode and #F5F5F5 in dark mode automatically. No overrides, no separate dark mode icon set required.
Step 4: Scalability Means Naming Conventions Matter
A naming convention sounds boring. It is actually the difference between a system that scales and one that collapses under its own weight eighteen months later. Use a consistent taxonomy: [category]/[name]/[variant]. So action/download/outline, status/warning/filled, navigation/home/outline. Every icon findable by category. Every variant predictably named.
This also feeds directly into your front-end implementation. If you are exporting to SVG sprites or using a tool like SVGR to generate React components, a consistent naming convention means your component names are predictable too. <IconActionDownload /> is infinitely more maintainable than <DownloadIcon2New />, which is a real component name I have seen in production code.
Step 5: Document Intent, Not Just Appearance
The icon design system for UK product design in 2026 needs to go beyond a grid of icons in a Figma page. Each icon, or at minimum each category, needs usage notes. What is the difference between status/warning and status/error? When do you use the filled variant versus the outline? Are there contexts where icons should never appear without a text label (hint: for accessibility, the answer is almost always yes).
The UK government’s accessibility requirements for public sector websites and apps are instructive here even if you are building a private SaaS product. WCAG 2.1 AA is the benchmark, and icons that carry meaning without a text alternative fail it. Documenting which icons are decorative and which are informational, and what the accessible label should be, is part of the system.
The Brand Alignment Layer
A coherent icon design system should feel like an extension of your brand, not a neutral utility grafted onto it. If your brand uses geometric, modernist typography and sharp angles, your icons should share that character. Soft, rounded icons in a brand that communicates precision and authority create a subconscious mismatch that users pick up on, even if they cannot articulate why something feels slightly off.
This is why picking an off-the-shelf library and calling it done is always a partial solution at best. Libraries like Phosphor or Lucide are excellent starting points and perfectly valid for early-stage products. But a mature product with a defined brand identity, especially one competing in UK fintech where trust signals are everything, should have icons that were either drawn to the brand’s geometric character or significantly adapted from a base library.
The practical route for most teams: start with a base library that is closest to your brand’s visual character, establish your grammar document, and then redraw any icons that deviate or that your product requires specifically. Over time, the bespoke set grows and the dependency on the base library shrinks. That is a healthy progression.
Consistency as a Product Value
Here is the thing that is easy to miss when you are deep in delivery cycles: icon consistency is not a nice-to-have design detail. It is a product quality signal. Users who encounter a polished, coherent icon set are building a subconscious model that this product was made carefully, by people who sweat the details. That trust compounds. It affects retention, it affects willingness to enter payment information, and in regulated sectors like fintech, it affects whether a user completes onboarding or bounces at the first moment of uncertainty.
A proper icon design system for UK product design in 2026 is not about aesthetics for aesthetics’ sake. It is about building a product that communicates competence at every pixel.
Figma’s pricing has crept up year on year. GitHub’s free tier comes with caveats. Google Analytics 4 remains a GDPR headache that most UK studios are quietly sweating over. If you’ve been running a small design or development practice and watching your SaaS subscriptions quietly devour your margin, there’s a genuinely viable escape hatch: self-hosting your core stack on a UK-based virtual private server. This guide walks through how to self host design tools on a UK VPS, specifically Penpot (your Figma replacement), Gitea (your GitHub replacement), and Plausible (your GA4 replacement), with enough technical detail to actually get you moving.
The total monthly outlay for a mid-spec VPS from a UK provider like Mythic Beasts, Memset, or Hetzner’s UK edge nodes typically runs between £8 and £25 depending on RAM. Compare that to Figma’s Organisation tier at roughly £40 per editor per month, GitHub Team at around £3.50 per user, and GA4’s 360 tier when you outgrow the free limits. The maths tilts hard in favour of self-hosting once you have more than two or three people on a team.
Choosing Your UK VPS Provider
Where your server physically lives matters for two reasons: latency for your UK team, and data residency under UK GDPR. The ICO’s guidance is clear that personal data should remain in jurisdictions with adequate protections, and keeping it on UK soil is the simplest way to stay compliant without writing a lengthy transfer impact assessment.
For this walkthrough, assume a VPS with 4GB RAM, 2 vCPUs, and 80GB SSD storage. That comfortably runs all three services simultaneously. You’ll want Ubuntu 24.04 LTS as your base OS, Docker and Docker Compose installed, and a domain with DNS pointing at your server’s IP. Nginx will act as a reverse proxy in front of everything, with Let’s Encrypt handling SSL via Certbot.
Once your VPS is provisioned, update the system and install Docker:
Penpot is the open-source design and prototyping tool from the Spanish studio Kaleidos. It’s browser-based, handles vector work and component libraries, and supports real-time collaboration. It won’t do everything Figma does, but for most UI design workflows it’s genuinely solid. The ICO would be pleased: no data leaving your server.
Penpot ships an official Docker Compose configuration. Grab it:
mkdir ~/penpot && cd ~/penpot
wget https://raw.githubusercontent.com/penpot/penpot/main/docker/images/docker-compose.yaml
wget https://raw.githubusercontent.com/penpot/penpot/main/docker/images/config.env
Open config.env and set the PENPOT_PUBLIC_URI to your subdomain, something like https://design.yourdomain.co.uk. Also set PENPOT_FLAGS to include enable-registration initially so you can create your admin account, then flip it to disable-registration afterwards. Run it:
docker compose -f docker-compose.yaml up -d
Penpot binds to port 3449 by default. Your Nginx config for this subdomain should proxy to that port, with SSL terminated at the Nginx layer. Once Certbot has issued your certificate and you’ve reloaded Nginx, your design.yourdomain.co.uk should show the Penpot login screen. Create your admin account, invite your team, and you’re running a fully functional self host design tools UK VPS setup in under an hour.
Deploying Gitea as Your Private Git Host
Gitea is a lightweight, self-hosted Git service written in Go. It’s fast, it uses minimal resources, and it has a web interface that feels close enough to GitHub that your team won’t mutiny. It handles repositories, issues, pull requests, webhooks, and CI integration with Gitea Actions.
Create a compose file at ~/gitea/docker-compose.yml:
SQLite works fine for teams under about 20 users. If you’re running something bigger, swap to PostgreSQL. The SSH port mapping (222:22) means your team will push with git remote add origin ssh://[email protected]:222/yourorg/repo.git. Nginx proxies HTTP traffic on port 3000 under its own subdomain. Run docker compose up -d, navigate to the web installer at your subdomain, and configure your instance. Disable public registration immediately.
Installing Plausible Analytics
Plausible is the privacy-first, GDPR-compliant analytics tool that’s been winning converts from Google Analytics for a few years now. The self-hosted version is functionally identical to the cloud product. For UK studios with clients asking about cookie banners and data processing agreements, hosting Plausible on your own UK VPS means the conversation becomes dramatically simpler: the analytics data never leaves your infrastructure.
According to the ICO’s UK GDPR guidance, analytics tools that collect personal data without consent require explicit opt-in. Plausible’s cookieless approach sidesteps most of this entirely, but self-hosting adds another layer of confidence for clients.
Clone the Plausible hosting repo:
git clone https://github.com/plausible/community-edition ~/plausible
cd ~/plausible
cp plausible-conf.env.example plausible-conf.env
Edit plausible-conf.env. Set BASE_URL to your analytics subdomain, generate a SECRET_KEY_BASE using openssl rand -base64 48, and configure your SMTP details for email verification. Then:
docker compose up -d
Plausible runs on port 8000. Nginx proxy config follows the same pattern as the others. Once it’s live, embed the lightweight tracking script (<script defer data-domain="yourclient.co.uk" src="https://analytics.yourdomain.co.uk/js/script.js"></script>) in your clients’ sites and you’re collecting privacy-respecting, UK-hosted analytics.
Nginx Reverse Proxy Config Pattern
Each service follows the same Nginx block structure. Here’s the template:
Replace PORT with 3449 for Penpot, 3000 for Gitea, and 8000 for Plausible. Run sudo certbot --nginx -d service.yourdomain.co.uk for each subdomain. Certbot will modify the block automatically to include the certificate paths. Reload Nginx after each one.
Backups and Maintenance
Self-hosting means you own the failure. Set up a daily cron job to dump Docker volumes to a compressed archive and rsync it off-server to a separate UK storage bucket or a second VPS. Mythic Beasts and Bytemark (now part of IONOS UK) both offer object storage with UK data residency. A backup that lives on the same physical host as your data is not a backup.
Docker image updates are the other recurring task. A monthly docker compose pull && docker compose up -d across all three services keeps you on current releases without much fuss. Subscribe to the Penpot, Gitea, and Plausible release channels on their respective Git hosts so you catch security patches promptly.
The total monthly compute bill for this three-service stack on a decent UK VPS sits somewhere around £12 to £20. For a small studio of four or five people, you’re almost certainly saving north of £100 per month compared to the equivalent SaaS tiers, and you’ve got full data sovereignty to boot. The setup overhead is a few hours, and the maintenance overhead is genuinely low once it’s running.
The Office for National Statistics is not a design studio. Nobody working there is chasing a Awwwards nomination or obsessing over whether their typeface feels “premium”. And yet, if you spend time actually reading through ONS data visualisations, you start to notice something genuinely impressive: these charts communicate extraordinarily well. They are sober, functional, and designed with a discipline that most commercial dashboard teams never achieve. That is worth pulling apart.
This is not a fan letter. There are real weaknesses in the ONS approach, and I’ll get to them. But the core methodology behind their data visualisation design is a masterclass in restraint, and restraint is the hardest thing to teach a designer who has spent three years in Figma making things look beautiful.
Why the ONS chart style is so readable (even when the data is horrible)
The first thing you notice looking at ONS charts is the absence of noise. No gradients. No 3D extrusions. No decorative gridlines. The chart area is clean to the point of feeling almost spartan, and that is not an accident. Their house style explicitly prioritises clarity over aesthetics, which sounds obvious but is remarkably rare in practice.
Their bar charts use a restrained palette: typically one primary colour for the main data series, with muted secondary tones for comparison series. The ONS colour set leans heavily on accessible combinations. They use a mid-blue as a workhorse colour, which sits well on both white and off-white backgrounds, and has solid contrast ratios for users with colour-vision deficiency. A lot of commercial dashboards still use red-green pairings for comparison metrics. The ONS almost never does this, because a meaningful percentage of the population cannot distinguish those colours reliably.
The typography choice is equally deliberate. Their publications use a clean sans-serif across chart labels, axis annotations, and source attributions. The hierarchy is strict: title at the top, subtitle directly beneath it, axis labels smaller and lighter, source line at the bottom in a noticeably reduced size. There is never any ambiguity about what you are supposed to read first. That reading order matters enormously when the data is genuinely complex, like age-stratified mortality statistics or regional employment breakdowns.
The colour palette decisions that data visualisation design uk ons charts gets right
Colour in data visualisation is one of those areas where designers consistently over-engineer things. The temptation is to build a ten-colour categorical palette because it feels comprehensive. The ONS approach keeps categorical colours to a sensible minimum, typically no more than six distinct values on a single chart, and when the data requires more categories than that, they restructure the chart rather than add more colours.
This is actually the correct answer, and most teams reach it too late, after building a twelve-colour legend that nobody can parse at a glance.
Their sequential palettes for choropleth maps (the regional breakdown maps you see for things like median household income or broadband coverage) use single-hue progressions, typically moving from a pale tint to a saturated anchor. This is textbook perceptual uniformity. The human visual system processes luminance gradients more reliably than hue shifts, so a light-to-dark single colour reads as a continuous scale far more intuitively than a rainbow palette. The ONS gets this right by default. A huge number of Local Authority and NHS data dashboards still use rainbow gradients in 2026, which is genuinely baffling.
Where the ONS approach has genuine gaps
Right. Enough praise. There are real criticisms to make.
Interactivity is sparse. The static chart approach works brilliantly for published reports and press releases, but the ONS digital presence has been slow to adopt genuinely exploratory visualisation. Their datasets are enormous and often the most interesting insights live in the sub-groups: age cohorts, regional splits, occupational categories. A well-built interactive chart could surface those without requiring a user to download a 40MB Excel spreadsheet. Tools like Observable Plot or D3.js could handle this elegantly. Some ONS pages now include simple chart builders, but the experience still feels like an afterthought compared to, say, what the Financial Times graphics team produces.
Responsiveness is another weak point. Many ONS chart embeds were designed for desktop screens and degrade awkwardly on mobile. Given that mobile accounts for a substantial share of web traffic across the board, a chart whose axis labels overlap at 375px width is simply not finished. This is a common problem across government digital estates, but it matters more for the ONS because their data is genuinely in the public interest.
And annotation. The ONS occasionally adds annotation to charts for major events (a shaded region for the pandemic period, a labelled inflection point for a policy change), but this is inconsistent. Annotation is arguably the most powerful tool in data storytelling. Telling the reader why a spike exists turns a confusing chart into a coherent argument.
What to actually steal for your own UK data dashboard
If you are building a dashboard for a UK public sector client, a fintech, or any product that has to make complex data legible to non-specialists, here is what I would take directly from the ONS playbook.
First: commit to a maximum of five categorical colours. Pick them based on contrast ratios and colour-vision accessibility, not because they match your brand guidelines. Your brand team will survive.
Second: use a strict typographic hierarchy with no more than three size levels across a chart. Title, axis labels, and source attribution. If you need a fourth level, the chart is probably too complicated.
Third: strip the gridlines back to horizontal-only for bar and line charts. Vertical gridlines rarely add information and almost always add visual weight. The ONS rarely uses them, and their charts are better for it.
Fourth: when your data has a natural comparison period (pre-pandemic vs post-pandemic, pre-Brexit vs post-Brexit trade figures), use a subtle background band to mark that period rather than relying on the user to cross-reference dates. The ONS does this consistently and it genuinely aids comprehension.
Fifth, and this is the big one: design for the worst-case reader, not the best-case reader. The ONS writes for a journalist filing a story at speed, a policy analyst who has fifty tabs open, and a curious member of the public who has never read a statistics bulletin before. All three need to extract the key finding within about ten seconds. If your dashboard only works for someone who already understands the domain, it is not doing its job.
The practical upshot for designers working with data
There is a quiet revolution happening in UK product teams around data literacy. More designers are expected to understand chart types, know when a line chart is wrong for the data they have, or recognise that a pie chart with seven segments is functionally useless. The ONS charts, for all their limitations, are a free masterclass in applied data visualisation design. They are public documents, they cover every chart type in common use, and they have been iterated over decades with a clear mandate to communicate reliably rather than impress.
Go look at them properly. Not to screenshot something pretty, but to study why something works. Then bring that rigour back to whatever dashboard you are building, and watch how much cleaner it gets when you stop trying to make it look clever.
Frequently Asked Questions
What chart types does the ONS use most often in their data visualisations?
The ONS relies heavily on line charts for time-series data, bar charts for categorical comparisons, and choropleth maps for regional breakdowns. They tend to avoid pie charts and 3D charts, which is consistent with established data visualisation best practice.
How do I make my data dashboard accessible to colourblind users?
Use single-hue sequential palettes for continuous data and limit categorical palettes to colours that differ in both hue and luminance. Tools like the Colour Contrast Analyser (free from the Paciello Group) can check your combinations. Avoid red-green pairings entirely.
Is the ONS data visualisation approach suitable for commercial or private sector dashboards?
The core principles, restraint in colour, strict typographic hierarchy, and clean chart areas, translate directly to commercial contexts. You may need to incorporate brand colours, but the structural decisions the ONS makes are universally applicable.
What tools do UK design teams typically use to build data dashboards?
Common choices include Tableau, Power BI, and Looker for business intelligence dashboards, and D3.js or Observable Plot for bespoke web-based visualisations. Figma is widely used for prototyping chart layouts before building in code.
How many colours should a data visualisation use?
Most data visualisation experts recommend a maximum of five to six distinct categorical colours per chart. Beyond that, the legend becomes too complex to parse quickly and the visual differentiation between series breaks down, particularly on small screens.
Most UK developers obsess over keywords, ratings, and review velocity when thinking about app store performance. Fair enough, those things matter. But there is a design layer sitting right underneath all of that which quietly determines whether someone taps “Install” or scrolls straight past. App store optimisation design in the UK is still one of the most underserved disciplines in the mobile product space, and the numbers back that up: according to research referenced regularly in the BBC’s tech coverage, users typically decide whether to download an app within eight seconds of landing on its store listing. Eight seconds. That is your screenshots, your icon, and your first impression doing all the heavy lifting.
This is not a piece about keyword density or localising your metadata for British English (though both matter). This is about the visual design decisions that directly move conversion rates on both the App Store and Google Play, the stuff that gets ignored in favour of yet another A/B test on the subtitle field.
Designer reviewing app store optimisation design UK layouts across multiple monitors in a modern studio
Why Your App Icon Is Doing More Work Than You Think
The icon is the first visual element a user encounters across search results, featured placements, and the home screen itself. Yet a surprising number of British indie developers and even some mid-sized studios treat it as an afterthought, something slapped together once the product is “finished”. That is backwards. An icon communicates brand personality, legibility at tiny sizes (29px in some contexts), and genre expectation all at once. A poorly rendered icon signals “this app might not be polished” before the user reads a single word of your description.
Practically speaking, the highest-performing icons in 2026 tend to do two things well. First, they use bold, simple shapes with strong contrast, detailed illustrations collapse into mud at 60px. Second, they avoid the temptation to include the app name inside the icon itself, which almost always makes things worse. Test your icon at the sizes Apple and Google actually render it, not just the 1024×1024 export sitting in your Figma file.
Screenshots: The Most Underestimated Conversion Asset in App Store Optimisation Design UK
Screenshots are not documentation. They are advertising. The distinction sounds obvious but the design implications are significant. On the App Store, users in the UK browse in portrait mode by default for iPhone listings, meaning your first two or three screenshots are visible without tapping, those are your prime conversion real estate. On Google Play, the feature graphic sits above screenshots on the store listing and acts as a hero banner. Both deserve proper design attention.
The pattern that consistently outperforms raw UI screenshots is the “caption plus context” approach: overlay a short benefit-led headline onto the screenshot, show the device frame, and sequence the screenshots to tell a story rather than dump features. Think of it as a micro sales funnel inside the listing itself. Screenshot one establishes the core value proposition. Screenshot two demonstrates a specific capability. Screenshot three handles an objection or reinforces a trust signal. By screenshot five or six, you are reaching the already-interested user, so you can go deeper.
Colour consistency across screenshots also matters more than most people assume. When a user swipes through a visually incoherent screenshot sequence, the subconscious read is “this product was not designed with care”. Establish a colour palette for your store creative that complements (but is not necessarily identical to) your in-app UI, and stick to it.
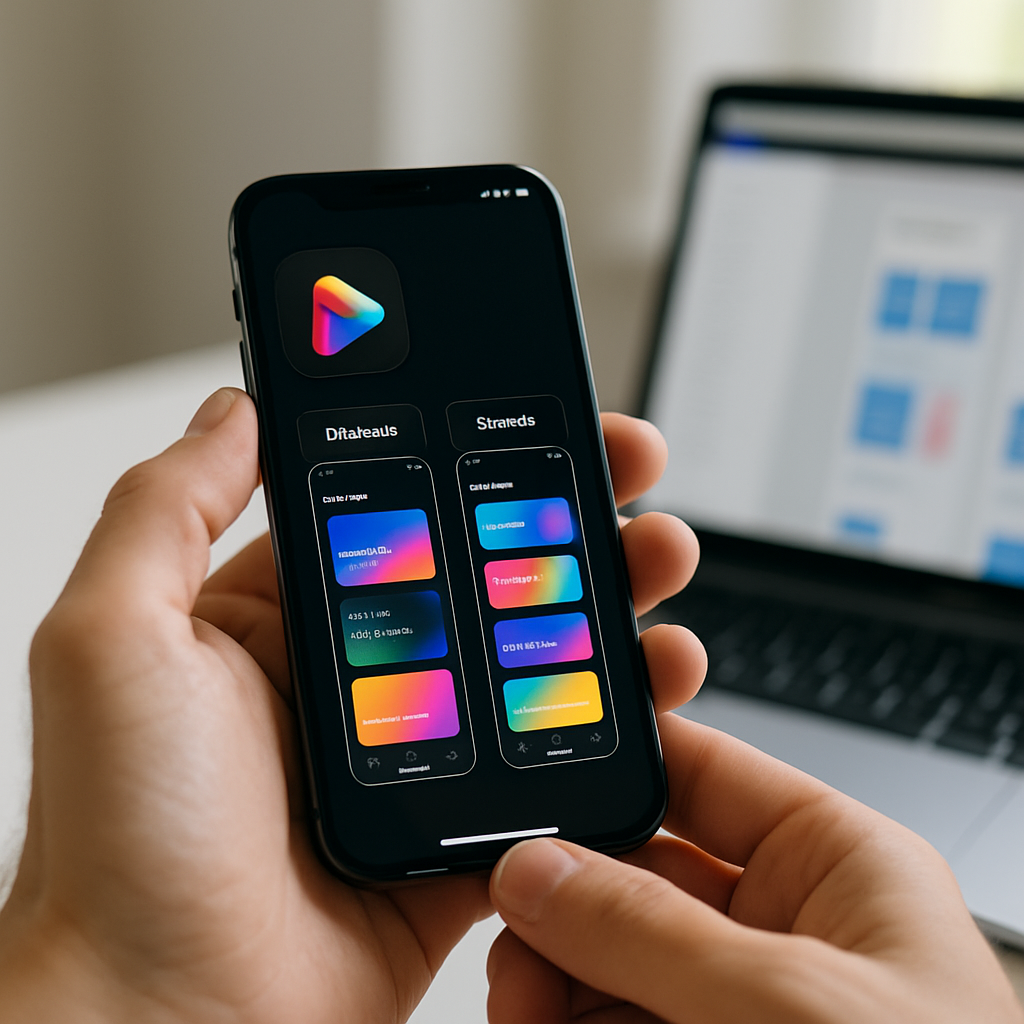
Close-up of smartphone showing app store optimisation design UK screenshot layout
Preview Videos: Worth the Effort, But Only If You Get the First Three Seconds Right
App preview videos autoplay silently in both the App Store and Google Play. Silent. That single fact changes everything about how you should approach them. Text overlays, motion graphics, and snappy visual cuts are not optional extras, they are the entire communication strategy. Voiceover is nice to have for the subset of users who unmute; it should not be load-bearing.
The research on preview video performance suggests a clear pattern: conversions lift when the first three seconds show the product in action, not a brand ident or animated logo sequence. UK developers building in competitive categories like fintech, fitness, or productivity face crowded listings, a slow-burn intro is a fast route to a skip. Open on the thing that makes your app interesting. Everything else follows.
Keep preview videos between 15 and 30 seconds. Anything longer and you are fighting attention spans that simply are not there on a store listing. Apple caps previews at 30 seconds for a reason.
The Google Play Feature Graphic (And Why UK Devs Keep Ignoring It)
If you publish on Google Play and your feature graphic is a stretched version of your icon on a gradient background, you are leaving conversion rate on the table. The feature graphic (1024x500px) appears prominently on the listing page and in some Google Play editorial placements. It is essentially a billboard.
Treat it like one. Use it to reinforce your app’s core promise with a strong visual hierarchy: one dominant image or illustration, a short headline if you have space, and brand colours that feel intentional. The feature graphic is particularly important for UK developers targeting Google’s Editors’ Choice placements, editorial teams at Google Play actually look at creative quality as part of featuring decisions.
How Conversion Rate Connects Back to Search Visibility
Here is where the visual design story gets interesting from a pure performance standpoint. Both Apple Search Ads and Google Play’s algorithm factor in conversion rate when determining how often your app surfaces for a given keyword. An app with a higher install-to-impression ratio earns better organic placement. Better placement means more impressions. More impressions (with a good conversion rate) means more installs. The flywheel is real, and it starts with visual quality.
This link between visual presentation and discoverability is not unlike what happens with websites. Just as on-page credibility signals affect how domains perform in organic search, your app’s store creative affects how the algorithm weights your listing. UK-based tool Search Engine Tuning offers a free SEO check for your website at searchenginetuning.co.uk, and the underlying logic it applies to domains and Google search performance maps neatly onto how store listings earn visibility. If your conversion signals are weak, no amount of keyword work fully compensates. Getting a handle on how to check your SEO and your store creative together gives you a more complete picture of your discoverability stack across both web and app surfaces.
The parallel is worth sitting with. On Google, domains with poor user engagement metrics see suppressed rankings even with strong backlink profiles. On the App Store and Google Play, apps with poor visual conversion signals see suppressed category and search placement even with strong keyword coverage. The mechanism differs; the principle is identical.
Running Visual A/B Tests Without Going Mad
Both platforms offer native A/B testing for store creatives. Apple calls theirs Product Page Optimisation; Google Play calls it Store Listing Experiments. Both are genuinely useful, both are underused by UK developers, and both require some patience, you need statistically meaningful traffic before conclusions are reliable, which for smaller apps can take several weeks.
The practical advice here: test one element at a time. Icon versus icon, screenshot set A versus screenshot set B. Changing multiple variables simultaneously makes it impossible to know what actually moved the needle. Start with your icon if you have not touched it in over a year, because that single asset affects impression-to-tap rate across every touchpoint where your app appears. Then move to screenshots. Then consider the preview video.
For developers working on UK-focused apps, anything from local service directories to council-linked utilities to British sports apps, there is also the question of cultural specificity in your store creative. UK users notice when screenshots feel generic or American. British idiom in caption text, familiar UI contexts (NHS-adjacent colour palettes for health apps, recognisable British street scenes for local apps), and culturally appropriate imagery all contribute to a conversion signal that feels trustworthy rather than imported.
Pulling It All Together
App store optimisation design in the UK is genuinely a craft discipline. It draws on brand identity, copywriting, motion design, and conversion rate optimisation simultaneously. The developers and studios doing it well are the ones who treat the store listing as a designed product in its own right, not an afterthought generated from leftover UI assets.
Worth noting: the same mindset that drives smart store creative, analysing what users respond to, iterating based on data, treating visibility as an engineered outcome rather than luck, applies equally well to web presence. Services like Search Engine Tuning, which specialise in helping UK businesses check their SEO and understand how google surfaces their domains via a free SEO check, reflect the same rigour that good ASO design demands. If you are shipping apps and running a web presence alongside, keeping both sides of your discoverability picture sharp is increasingly non-negotiable.
Pick one asset to redesign this week. Not because it is a small task, but because it is a high-leverage one. Visual quality compounds.
Frequently Asked Questions
What is app store optimisation design and how is it different from regular ASO?
Regular ASO tends to focus on keywords, ratings, and metadata. App store optimisation design specifically refers to the visual assets on your store listing, icons, screenshots, preview videos, and feature graphics, and how they are designed to maximise conversion rate. It is a distinct discipline that sits at the intersection of graphic design, brand identity, and conversion rate optimisation.
How much can better screenshots actually improve my app's download rate?
Case studies from developers using Apple’s Product Page Optimisation tool regularly report conversion rate lifts of 15 to 40 percent from screenshot redesigns alone, though results vary significantly by category and audience. Even a modest 10 percent improvement compounds meaningfully when multiplied across hundreds of thousands of impressions. The first two screenshots visible in portrait browse mode typically have the largest individual impact.
Do App Store and Google Play have different visual requirements I need to design for?
Yes, meaningfully so. The App Store uses portrait screenshot orientation for iPhone by default, with preview videos capped at 30 seconds. Google Play prominently features a 1024x500px feature graphic at the top of the listing, which Apple does not have an equivalent of. Icon dimensions and safe zone guidelines also differ between platforms, so designing separate assets rather than repurposing one set across both is strongly advisable.
How does visual conversion rate affect my app's search ranking in the App Store?
Both Apple and Google factor conversion rate into their search and browse ranking algorithms. An app that converts a higher proportion of impressions into installs is rewarded with better placement in search results and category listings. This creates a direct link between visual design quality and organic discoverability, poor store creative suppresses ranking even when keyword coverage is strong.
How long does it take to see results from redesigning my app's store visuals?
If you are running native A/B tests through Product Page Optimisation or Google Play Store Listing Experiments, expect to need at least two to four weeks of data for statistically reliable results, longer if your app has lower traffic volumes. Organic impact from a live redesign (without a formal test) can show up in conversion metrics within a week, though isolating the visual change from other variables is harder without a controlled experiment.
Raw data is boring. A spreadsheet of ONS broadband penetration figures or Ofcom spectrum usage statistics is about as gripping as a council planning notice. But bind those same numbers to a living, breathing SVG illustration and suddenly you have something people actually want to look at. That is the promise of reactive SVG data visualisation, and D3.js is the library that makes it properly possible without reaching for a bloated charting framework that hides all the interesting bits from you.
This article is a hands-on walkthrough. We are going to fetch real UK open data, parse it, and use D3 to bind it to SVG elements so the visuals respond dynamically to the figures. No toy datasets. No made-up numbers. Real data from sources the UK government and regulators actually publish.
Developer building a reactive SVG data visualisation UK project on a large monitor in a modern studio
Why SVG and D3 Instead of Canvas or a Chart Library?
Canvas is fast for pixel-heavy rendering. Chart libraries like Chart.js are quick to deploy. But neither gives you the fine-grained control that reactive SVG data visualisation demands when you want illustrations, not just bar charts. SVG is part of the DOM, which means every shape, path, and text node is queryable, styleable, and animatable with CSS. D3 exploits this completely.
The data join pattern at D3’s core (enter, update, exit) is genuinely elegant once it clicks. You tell D3 what data you have, what DOM elements should represent it, and what to do when data changes. The library handles the rest. It is declarative in the right places and imperative where you need control. I have used it on projects ranging from tiny inline sparklines to full-screen choropleth maps, and I keep coming back because nothing else gives you the same ceiling.
Getting Your UK Open Data: ONS and Ofcom
The Office for National Statistics publishes machine-readable datasets through its ONS API, which returns JSON in a fairly navigable structure. Ofcom releases its Connected Nations datasets as downloadable CSVs covering broadband coverage by local authority district. Both are genuinely free, regularly updated, and ideal for a reactive SVG project.
For this walkthrough we are using Ofcom’s Connected Nations data: specifically, the percentage of premises with access to gigabit-capable broadband by UK nation and region. It is a flat CSV, which means we can use D3’s built-in d3.csv() loader and avoid writing a custom parser.
import * as d3 from "https://cdn.jsdelivr.net/npm/d3@7/+esm";

const DATA_URL = "https://your-hosted-copy/ofcom-connected-nations.csv";

d3.csv(DATA_URL, d => ({
  region: d["Region"],
  gigabit_pct: +d["Gigabit capable (%)"],
  premises: +d["Total premises"]
})).then(data => {
  render(data);
});
Note the + coercion on the numeric fields. D3’s CSV parser returns strings by default. Skip that coercion and your scales will treat “84” as text, which produces spectacularly wrong output. Ask me how I know.
Building the SVG Container and Scales
The margin convention in D3 is worth following even when it feels ceremonial. It keeps your axes and labels inside the viewport without wrestling with overflow: visible hacks later.
Using viewBox instead of hard-coded pixel dimensions is non-negotiable if you want the illustration to be responsive. The SVG scales itself to the container, and your D3 coordinates stay consistent regardless of screen size. This is how reactive SVG data visualisation actually becomes reactive to viewport changes as well as data changes.
Close-up of D3.js code powering a reactive SVG data visualisation UK broadband chart on a laptop screen
Now the scales. For a horizontal bar chart of regional broadband coverage:
const x = d3.scaleLinear()
  .domain([0, 100])
  .range([0, width]);

const y = d3.scaleBand()
  .domain(data.map(d => d.region))
  .range([0, height])
  .padding(0.3);
scaleBand handles the spacing maths for categorical axes so you do not have to. The padding value of 0.3 adds 30% whitespace between bands, which visually separates the bars without making them hair-thin.
The D3 Data Join: Where the Reactive Magic Happens
This is the part that confuses people initially and then becomes the thing they explain excitedly to colleagues. The data join binds an array of data objects to a selection of DOM elements. Elements that do not yet exist go into the enter selection. Elements whose data has disappeared go into the exit selection. Everything in between is the update selection.
const bars = svg.selectAll("rect.bar")
  .data(data, d => d.region); // key function keeps transitions smooth

// Enter: create new bars
bars.enter()
  .append("rect")
  .attr("class", "bar")
  .attr("y", d => y(d.region))
  .attr("height", y.bandwidth())
  .attr("x", 0)
  .attr("width", 0) // start at zero for transition
  .attr("fill", "#4F46E5")
  .merge(bars) // merge with update selection
  .transition()
  .duration(800)
  .ease(d3.easeCubicOut)
  .attr("width", d => x(d.gigabit_pct));

// Exit: remove stale bars
bars.exit()
  .transition()
  .duration(400)
  .attr("width", 0)
  .remove();
The key function in .data(data, d => d.region) is critical for smooth transitions. Without it, D3 matches data to elements by index. With it, elements are bound by region name, so if you filter or reorder the dataset the bars animate to their new positions rather than snapping jarringly.
Making It Genuinely Reactive: Filtering and UI Controls
The real payoff of reactive SVG data visualisation comes when you wire up UI controls that change the underlying data and re-call the render function. Add a simple dropdown that filters by UK nation:
Each time the user changes the dropdown, render(filtered) runs with a new data array. D3 works out which bars need to be added, which need updating, and which need removing. You do not manually manipulate the DOM. That is the whole point.
Going Beyond Bar Charts: Binding Data to Illustrated SVG Paths
Bar charts are fine, but the really interesting territory is binding data to custom SVG illustrations, like a stylised map of the UK’s twelve regions, or an illustrated diagram of network infrastructure where path stroke-width encodes bandwidth figures.
The principle is identical. Load an SVG file (exported from Figma or Illustrator), inline it in your HTML, then use D3 to select specific paths by their id or data-region attributes and drive their visual properties from data. Colour fills from a sequential scale, opacity driven by coverage percentage, stroke animations that pulse for regions below a threshold: all of it is just attribute binding.
This approach turns a static SVG illustration into a living data artefact. Your designer exports a clean regional map from Figma. Your D3 code breathes data into it. The two disciplines talk to each other through attribute naming conventions agreed upfront. It is the kind of collaboration between design and dev that produces genuinely impressive output.
Performance and Accessibility Notes
A few things worth pinning to your monitor. First, ARIA labels. SVG is not inherently accessible. Add role="img" and aria-label to your SVG container, and use <title> and <desc> elements inside individual groups for screen readers. The Web Accessibility Initiative has clear guidance on SVG accessibility patterns.
Second, transitions look great but they are not free. If you are rendering several hundred elements, consider using d3.transition() with a shared timer rather than individual transitions, and cap your dataset size where the visual encoding stops being legible anyway. A choropleth with 400 regions is just noise.
Third, host your open data files yourself or proxy them. Fetching directly from government data portals in production is fragile; file structures change, URLs break, and there is no SLA. Pull the data into your own infrastructure on a schedule and serve it from there.
The Bottom Line on D3 and Open Data
Reactive SVG data visualisation using UK open datasets is one of those projects that teaches you an enormous amount in a short time. You learn D3’s join model. You learn how SVG coordinate systems actually work. You learn that ONS data is more useful than most developers realise. And you produce something genuinely worth showing in a portfolio, because it combines real public information with craft-level visual thinking. That combination is rare, and it shows.
The Ofcom and ONS datasets are updated regularly, which means a project you build this month stays relevant as new figures land. Wire it up to a scheduled data fetch, add a timestamp to your visualisation, and you have something that essentially maintains itself.
Frequently Asked Questions
What is reactive SVG data visualisation and how does it differ from a static chart?
Reactive SVG data visualisation means your SVG elements update dynamically when the underlying data changes, using a library like D3.js to bind data to DOM attributes in real time. A static chart is a fixed image or pre-rendered output; a reactive one responds to user input, data filters, or live data feeds without a page reload.
Where can I download free UK open datasets to use with D3.js?
The Office for National Statistics (ons.gov.uk) and Ofcom both publish machine-readable open datasets covering topics from broadband coverage to regional demographics. The ONS also provides a developer API that returns JSON, and Ofcom’s Connected Nations data is available as downloadable CSV files updated annually.
Do I need to know D3.js well to build reactive SVG illustrations, or can beginners start here?
D3’s data join pattern has a learning curve, so some JavaScript confidence is recommended before diving in. That said, the enter/update/exit model is well-documented and once it clicks, building reactive SVG visualisations becomes much more intuitive. Starting with a simple bar chart bound to a CSV is the fastest path to understanding it properly.
Can I import an SVG illustration from Figma and bind data to it using D3?
Yes, and this is one of the most powerful workflows available. Export your SVG from Figma, inline it in your HTML, and give key paths meaningful IDs or data attributes. D3 can then select those paths and drive their fill, opacity, stroke, or transform properties directly from your dataset.
How do I make D3 SVG visualisations accessible for screen readers?
Add role=”img” and an aria-label to the SVG container, and include a
element as the first child of the SVG for a short description. For more complex visuals, a <desc> element and aria-describedby attribute provide additional context. Avoid encoding critical information solely through colour, and ensure interactive elements are keyboard-navigable.</p>
<p><script type="application/ld+json">
{
"@context": "https://schema.org",
"@type": "FAQPage",
"mainEntity": [
{
"@type": "Question",
"name": "What is reactive SVG data visualisation and how does it differ from a static chart?",
"acceptedAnswer": {
"@type": "Answer",
"text": "Reactive SVG data visualisation means your SVG elements update dynamically when the underlying data changes, using a library like D3.js to bind data to DOM attributes in real time. A static chart is a fixed image or pre-rendered output; a reactive one responds to user input, data filters, or live data feeds without a page reload."
}
},
{
"@type": "Question",
"name": "Where can I download free UK open datasets to use with D3.js?",
"acceptedAnswer": {
"@type": "Answer",
"text": "The Office for National Statistics (ons.gov.uk) and Ofcom both publish machine-readable open datasets covering topics from broadband coverage to regional demographics. The ONS also provides a developer API that returns JSON, and Ofcom's Connected Nations data is available as downloadable CSV files updated annually."
}
},
{
"@type": "Question",
"name": "Do I need to know D3.js well to build reactive SVG illustrations, or can beginners start here?",
"acceptedAnswer": {
"@type": "Answer",
"text": "D3's data join pattern has a learning curve, so some JavaScript confidence is recommended before diving in. That said, the enter/update/exit model is well-documented and once it clicks, building reactive SVG visualisations becomes much more intuitive. Starting with a simple bar chart bound to a CSV is the fastest path to understanding it properly."
}
},
{
"@type": "Question",
"name": "Can I import an SVG illustration from Figma and bind data to it using D3?",
"acceptedAnswer": {
"@type": "Answer",
"text": "Yes, and this is one of the most powerful workflows available. Export your SVG from Figma, inline it in your HTML, and give key paths meaningful IDs or data attributes. D3 can then select those paths and drive their fill, opacity, stroke, or transform properties directly from your dataset."
}
},
{
"@type": "Question",
"name": "How do I make D3 SVG visualisations accessible for screen readers?",
"acceptedAnswer": {
"@type": "Answer",
"text": "Add role=\"img\" and an aria-label to the SVG container, and include a element as the first child of the SVG for a short description. For more complex visuals, a element and aria-describedby attribute provide additional context. Avoid encoding critical information solely through colour, and ensure interactive elements are keyboard-navigable."
}
}
]
}
</script></p>
</div>
<div style="margin-top:var(--wp--preset--spacing--40)" class="wp-block-post-date has-small-font-size"><a href="https://launchpad-design.co.uk/reactive-svg-data-visualisation-uk-d3-open-data/"><time datetime="2026-07-23T21:03:20+00:00">July 23, 2026</time></a></div></div>
</li><li class="wp-block-post post-198 post type-post status-publish format-standard has-post-thumbnail hentry category-design category-nerdy category-web-design tag-fca-consumer-duty-design tag-financial-promotion-rules-ui tag-fintech-ux-design-compliance tag-regulatory-ux-design tag-uk-fintech-product-design">
<div class="wp-block-group alignfull is-layout-flow wp-block-group-is-layout-flow" style="padding-top:var(--wp--preset--spacing--60);padding-bottom:var(--wp--preset--spacing--60)"><figure style="aspect-ratio:3/2" class="wp-block-post-featured-image"><a href="https://launchpad-design.co.uk/designing-fintech-interfaces-fca-regulatory-compliance-uk/" target="_self" ><img width="1024" height="1024" src="https://launchpad-design.co.uk/wp-content/uploads/2026/07/product-designer-reviewing-fintech-ux-design-compliance-on-m-1.png" class="attachment-full size-full wp-post-image" alt="Designing Fintech Interfaces for UK Regulatory Compliance: FCA Rules Every Product Designer Should Know" style="width:100%;height:100%;object-fit:cover;" decoding="async" loading="lazy" srcset="https://launchpad-design.co.uk/wp-content/uploads/2026/07/product-designer-reviewing-fintech-ux-design-compliance-on-m-1.png 1024w, https://launchpad-design.co.uk/wp-content/uploads/2026/07/product-designer-reviewing-fintech-ux-design-compliance-on-m-1-300x300.png 300w, https://launchpad-design.co.uk/wp-content/uploads/2026/07/product-designer-reviewing-fintech-ux-design-compliance-on-m-1-150x150.png 150w, https://launchpad-design.co.uk/wp-content/uploads/2026/07/product-designer-reviewing-fintech-ux-design-compliance-on-m-1-768x768.png 768w" sizes="auto, (max-width: 1024px) 100vw, 1024px" /></a></figure>
<h2 class="wp-block-post-title has-x-large-font-size"><a href="https://launchpad-design.co.uk/designing-fintech-interfaces-fca-regulatory-compliance-uk/" target="_self" >Designing Fintech Interfaces for UK Regulatory Compliance: FCA Rules Every Product Designer Should Know</a></h2>
<div class="entry-content alignfull wp-block-post-content has-medium-font-size is-layout-flow wp-block-post-content-is-layout-flow"><p>There is a version of product design that lives entirely in the aesthetic layer: beautiful gradients, satisfying micro-interactions, typography that makes you feel something. And then there is fintech UX design compliance, which lives in a much more interesting (and considerably more stressful) neighbourhood. In the UK, the Financial Conduct Authority has made it very clear that how you design a financial product is no longer a purely creative decision. It is a regulated one.</p>
<p>The FCA’s Consumer Duty rules, which came into full force in 2023 and have been actively enforced since, essentially bake good UX into law. If your interface obscures fees, buries risk warnings, or nudges users towards products that are not in their best interests, that is not just a design flaw. That is a compliance failure. For product designers working on UK fintech products in 2026, understanding this regulatory context is not optional. It is part of the job description.</p>
<figure class="wp-block-image size-large"><img loading="lazy" decoding="async" width="1024" height="1024" src="https://launchpad-design.co.uk/wp-content/uploads/2026/07/product-designer-reviewing-fintech-ux-design-compliance-on-m-1.png" alt="Product designer reviewing fintech UX design compliance on mobile interface screens in a London office" class="wp-image-196" srcset="https://launchpad-design.co.uk/wp-content/uploads/2026/07/product-designer-reviewing-fintech-ux-design-compliance-on-m-1.png 1024w, https://launchpad-design.co.uk/wp-content/uploads/2026/07/product-designer-reviewing-fintech-ux-design-compliance-on-m-1-300x300.png 300w, https://launchpad-design.co.uk/wp-content/uploads/2026/07/product-designer-reviewing-fintech-ux-design-compliance-on-m-1-150x150.png 150w, https://launchpad-design.co.uk/wp-content/uploads/2026/07/product-designer-reviewing-fintech-ux-design-compliance-on-m-1-768x768.png 768w" sizes="auto, (max-width: 1024px) 100vw, 1024px" /><figcaption>Product designer reviewing fintech UX design compliance on mobile interface screens in a London office</figcaption></figure>
<h2>What the FCA Consumer Duty Actually Means for UX Designers</h2>
<p>The FCA’s Consumer Duty framework introduced four outcome areas that financial firms must demonstrate: products and services, price and value, consumer understanding, and consumer support. Each of those maps directly onto design decisions. Consumer understanding, in particular, is where the design team lives.</p>
<p>The FCA is explicit that firms must ensure communications are <em>understood</em>, not merely <em>provided</em>. That is a significant shift. It means a modal dialogue crammed with 800 words of legal copy does not discharge your regulatory obligation. It just creates evidence that you tried and failed. The regulator expects firms to test comprehension, iterate on clarity, and document the process. If you want to read the full framework, the <a href="https://www.fca.org.uk/firms/consumer-duty" target="_blank" rel="noopener noreferrer">FCA’s Consumer Duty guidance</a> is dense but worth the effort.</p>
<p>For designers, this translates into some very concrete constraints. Risk warnings must be legible at the point of decision, not buried in a footer. Fee structures must be presented before a user commits, not revealed in an email receipt. And nudge patterns that steer users towards higher-margin products must be demonstrably in the customer’s interest, not just the firm’s.</p>
<h2>Financial Promotion Rules and What They Mean for UI Copy</h2>
<p>Separate from Consumer Duty but equally relevant is the FCA’s financial promotions regime. Any communication that is an invitation or inducement to engage in financial activity must be fair, clear, and not misleading. That includes the copy on your onboarding screens, your push notifications, and yes, even those little celebratory animations when a user hits a savings goal.</p>
<p>The practical implication for fintech UX design compliance is that your content design team and your legal team need to be in the same room, or at minimum the same Figma file. Headlines like “Earn 5% on your savings” need qualification. Risk warnings on investment products need to meet the FCA’s prescribed prominence rules, which specify minimum font sizes and contrast ratios relative to surrounding promotional content.</p>
<p>This is where fintech diverges sharply from other product verticals. A consumer app selling gym memberships can lean on persuasion patterns freely. A trading app cannot use the same playbook without risking enforcement action.</p>
<figure class="wp-block-image size-large"><img loading="lazy" decoding="async" width="1024" height="1024" src="https://launchpad-design.co.uk/wp-content/uploads/2026/07/close-up-of-smartphone-showing-fintech-ux-design-compliance-2.png" alt="Close-up of smartphone showing fintech UX design compliance warning text in a banking app interface" class="wp-image-197" srcset="https://launchpad-design.co.uk/wp-content/uploads/2026/07/close-up-of-smartphone-showing-fintech-ux-design-compliance-2.png 1024w, https://launchpad-design.co.uk/wp-content/uploads/2026/07/close-up-of-smartphone-showing-fintech-ux-design-compliance-2-300x300.png 300w, https://launchpad-design.co.uk/wp-content/uploads/2026/07/close-up-of-smartphone-showing-fintech-ux-design-compliance-2-150x150.png 150w, https://launchpad-design.co.uk/wp-content/uploads/2026/07/close-up-of-smartphone-showing-fintech-ux-design-compliance-2-768x768.png 768w" sizes="auto, (max-width: 1024px) 100vw, 1024px" /><figcaption>Close-up of smartphone showing fintech UX design compliance warning text in a banking app interface</figcaption></figure>
<h2>How Monzo, Starling, and Revolut Handle This in Practice</h2>
<p>The three most prominent UK challenger banks handle compliance UX in noticeably different ways, and studying their approaches is genuinely instructive.</p>
<p>Monzo has long been the posterchild for plain-English financial communication. Their overdraft flow, for example, presents the daily fee in pence before a user activates the facility, shown in a large, unambiguous numeral rather than buried in a percentage APR calculation. They also use a colour system that clearly distinguishes between informational states and warning states, making it harder to accidentally miss a risk notice. This is not accidental; it reflects deliberate fintech UX design compliance thinking embedded in their design system.</p>
<p>Starling takes a slightly more clinical approach. Their investment and savings product flows use a stepped disclosure model: each screen introduces one concept, confirms understanding, then advances. It is slower, and some users find it friction-heavy, but from a regulatory standpoint it creates a clear audit trail of informed consent. Starling also applies consistent typographic hierarchy to risk warnings, using the same visual weight as primary action copy rather than relegating warnings to a smaller grey typeface beneath the CTA.</p>
<p>Revolut’s approach is more interesting to scrutinise, particularly in their crypto and stock trading features. Their disclaimers appear in full before a first trade and are summarised inline on repeat visits. This progressive disclosure model threads a needle between regulatory obligation and user experience, avoiding the pattern of warning fatigue whilst still meeting FCA prominence requirements. It is clever, though it has drawn some attention from the regulator on specific product categories in the past.</p>
<h2>Dark Patterns Are Specifically on the FCA’s Radar</h2>
<p>The FCA published guidance in 2024 explicitly calling out dark patterns in financial services interfaces. Pre-ticked consent boxes, hard-to-cancel subscriptions, and confirmshaming language on opt-out screens are all cited as potential Consumer Duty breaches. The regulator’s definition of a dark pattern in this context is broadly consistent with the European Data Protection Board’s definition but applied through a financial harm lens.</p>
<p>For product designers, this means doing a proper dark pattern audit is no longer just an ethical nicety. It is a compliance audit. Tools like the Deceptive Design Pattern Checker can help at the component level, but the real work is in user journey mapping with the question: does this flow serve the user’s financial interests, or ours?</p>
<p>Interestingly, this regulatory pressure is pushing fintech firms towards something that resembles good business ethics anyway. Firms building a genuine <a href="https://www.r2g.co.uk/insights/does-having-a-sustainability-strategy-improve-revenue/" rel="noopener">sustainability strategy</a> around long-term customer relationships tend to find that FCA-compliant UX and commercially successful UX are not actually in tension; customers who feel respected and informed tend to stay and spend more.</p>
<h2>Building Compliance Into Your Design System From Day One</h2>
<p>The most common mistake I see in fintech product teams is treating regulatory compliance as a final-stage review process. Legal checks the screens before launch, red-lines three things, the designers groan, and everyone ships something that satisfies neither the regulator nor the user.</p>
<p>The smarter approach is to build compliance tokens directly into your design system. Create a dedicated risk-disclosure text style with the correct contrast ratio and minimum size baked in. Build a standard warning component that cannot be resized below the FCA’s prominence threshold. Define a colour token specifically for financial risk states that sits outside your brand palette so it cannot be overridden by a well-meaning designer chasing aesthetic consistency.</p>
<p>Document your rationale. The FCA increasingly expects firms to evidence that their design decisions were made with consumer outcomes in mind. A Figma annotation or a brief design decision record noting “risk warning meets FCA prominence guidelines” is not bureaucratic overhead. It is a defensible paper trail.</p>
<p>Fintech UX design compliance is one of the few areas where being a nerd about the rules genuinely pays off. The designers who understand the regulatory layer, who can read an FCA policy statement and translate it into component-level decisions, are the ones building products that can actually survive a supervisory review. And in 2026, with Consumer Duty enforcement moving into its active monitoring phase, that is a skill worth having.</p>
<h2>Frequently Asked Questions</h2>
<h3>What is FCA Consumer Duty and how does it affect UX design?</h3>
<p>The FCA’s Consumer Duty framework requires financial firms to demonstrate that their products deliver good outcomes for customers, including in the area of consumer understanding. For UX designers, this means interfaces must present fees, risks, and terms clearly and comprehensibly, not just make them technically available. Poor information hierarchy or deliberate obscuration can constitute a compliance failure.</p>
<h3>Do risk warnings need to meet specific visual design requirements under FCA rules?</h3>
<p>Yes. FCA financial promotion rules specify that risk warnings must be given appropriate prominence relative to the promotional content they accompany. In practice, this means risk copy must not be significantly smaller, lower-contrast, or less visually weighted than the positive claim it qualifies. Designers should treat this as a component-level constraint built into their design system.</p>
<h3>Are dark patterns in fintech interfaces illegal in the UK?</h3>
<p>Not automatically illegal, but the FCA has explicitly identified dark patterns as potential breaches of Consumer Duty, which carries significant regulatory consequences including fines and enforcement action. Pre-ticked boxes, hidden cancellation flows, and manipulative opt-out language are specifically flagged in FCA guidance published in 2024.</p>
<h3>How do Monzo and Starling differ in their approach to regulatory UX compliance?</h3>
<p>Monzo tends to use plain-English, single-figure fee presentations at key decision points, with a clear visual distinction between informational and warning states. Starling uses a stepped disclosure model that introduces one concept per screen, creating a clearer audit trail of informed consent. Both approaches are designed to satisfy Consumer Duty’s consumer understanding outcome.</p>
<h3>Should product designers in fintech be involved in legal and compliance reviews?</h3>
<p>Absolutely, and increasingly this is expected rather than optional. The FCA wants firms to evidence that design decisions were made with consumer outcomes in mind, which means designers need to understand the regulatory rationale behind copy and interface constraints, not just receive red-lined screen notes from legal. Building compliance into design systems from the start is significantly more efficient than retrospective review.</p>
<p><script type="application/ld+json">
{
"@context": "https://schema.org",
"@type": "FAQPage",
"mainEntity": [
{
"@type": "Question",
"name": "What is FCA Consumer Duty and how does it affect UX design?",
"acceptedAnswer": {
"@type": "Answer",
"text": "The FCA's Consumer Duty framework requires financial firms to demonstrate that their products deliver good outcomes for customers, including in the area of consumer understanding. For UX designers, this means interfaces must present fees, risks, and terms clearly and comprehensibly, not just make them technically available. Poor information hierarchy or deliberate obscuration can constitute a compliance failure."
}
},
{
"@type": "Question",
"name": "Do risk warnings need to meet specific visual design requirements under FCA rules?",
"acceptedAnswer": {
"@type": "Answer",
"text": "Yes. FCA financial promotion rules specify that risk warnings must be given appropriate prominence relative to the promotional content they accompany. In practice, this means risk copy must not be significantly smaller, lower-contrast, or less visually weighted than the positive claim it qualifies. Designers should treat this as a component-level constraint built into their design system."
}
},
{
"@type": "Question",
"name": "Are dark patterns in fintech interfaces illegal in the UK?",
"acceptedAnswer": {
"@type": "Answer",
"text": "Not automatically illegal, but the FCA has explicitly identified dark patterns as potential breaches of Consumer Duty, which carries significant regulatory consequences including fines and enforcement action. Pre-ticked boxes, hidden cancellation flows, and manipulative opt-out language are specifically flagged in FCA guidance published in 2024."
}
},
{
"@type": "Question",
"name": "How do Monzo and Starling differ in their approach to regulatory UX compliance?",
"acceptedAnswer": {
"@type": "Answer",
"text": "Monzo tends to use plain-English, single-figure fee presentations at key decision points, with a clear visual distinction between informational and warning states. Starling uses a stepped disclosure model that introduces one concept per screen, creating a clearer audit trail of informed consent. Both approaches are designed to satisfy Consumer Duty's consumer understanding outcome."
}
},
{
"@type": "Question",
"name": "Should product designers in fintech be involved in legal and compliance reviews?",
"acceptedAnswer": {
"@type": "Answer",
"text": "Absolutely, and increasingly this is expected rather than optional. The FCA wants firms to evidence that design decisions were made with consumer outcomes in mind, which means designers need to understand the regulatory rationale behind copy and interface constraints, not just receive red-lined screen notes from legal. Building compliance into design systems from the start is significantly more efficient than retrospective review."
}
}
]
}
</script></p>
</div>
<div style="margin-top:var(--wp--preset--spacing--40)" class="wp-block-post-date has-small-font-size"><a href="https://launchpad-design.co.uk/designing-fintech-interfaces-fca-regulatory-compliance-uk/"><time datetime="2026-07-17T09:43:56+00:00">July 17, 2026</time></a></div></div>
</li></ul>
<div class="wp-block-group has-global-padding is-layout-constrained wp-block-group-is-layout-constrained" style="padding-top:var(--wp--preset--spacing--60);padding-bottom:var(--wp--preset--spacing--60)"></div>
<div class="wp-block-group alignwide has-global-padding is-layout-constrained wp-block-group-is-layout-constrained"><nav class="alignwide wp-block-query-pagination is-content-justification-space-between is-layout-flex wp-container-core-query-pagination-is-layout-4dea2dca wp-block-query-pagination-is-layout-flex" aria-label="Pagination">
<a href="https://launchpad-design.co.uk/author/sophie/page/2/" class="wp-block-query-pagination-previous"><span class='wp-block-query-pagination-previous-arrow is-arrow-arrow' aria-hidden='true'>←</span>Previous Page</a>
<div class="wp-block-query-pagination-numbers"><a class="page-numbers" href="https://launchpad-design.co.uk/author/sophie/">1</a>
<a class="page-numbers" href="https://launchpad-design.co.uk/author/sophie/page/2/">2</a>
<span aria-current="page" class="page-numbers current">3</span>
<a class="page-numbers" href="https://launchpad-design.co.uk/author/sophie/page/4/">4</a>
<a class="page-numbers" href="https://launchpad-design.co.uk/author/sophie/page/5/">5</a>
<a class="page-numbers" href="https://launchpad-design.co.uk/author/sophie/page/6/">6</a></div>
<a href="https://launchpad-design.co.uk/author/sophie/page/4/" class="wp-block-query-pagination-next">Next Page<span class='wp-block-query-pagination-next-arrow is-arrow-arrow' aria-hidden='true'>→</span></a>
</nav></div>
</div>
</div>
<div class="wp-block-column is-layout-flow wp-block-column-is-layout-flow" style="flex-basis:25%">
<h2 class="wp-block-heading has-small-font-size" style="font-style:normal;font-weight:600;letter-spacing:1.6px;text-transform:uppercase">The Latest</h2>
<div style="height:var(--wp--preset--spacing--20)" aria-hidden="true" class="wp-block-spacer"></div>
<div class="wp-block-query is-layout-flow wp-block-query-is-layout-flow"><ul class="wp-block-post-template is-layout-flow wp-block-post-template-is-layout-flow"><li class="wp-block-post post-348 post type-post status-publish format-standard has-post-thumbnail hentry category-design category-web-design tag-media-product-design tag-paywall-design-patterns tag-subscriber-retention-ui tag-subscription-dashboard-ux tag-uk-digital-subscription-ux-design">
<div class="wp-block-group is-vertical is-layout-flex wp-container-core-group-is-layout-54d079fe wp-block-group-is-layout-flex"><h3 class="wp-block-post-title has-large-font-size"><a href="https://launchpad-design.co.uk/uk-digital-subscription-ux-design-guardian-times-telegraph/" target="_self" >How British Newspapers Are Redesigning Their Digital Subscriptions UX to Stop the Bleed</a></h3>
<div class="wp-block-post-date has-small-font-size"><a href="https://launchpad-design.co.uk/uk-digital-subscription-ux-design-guardian-times-telegraph/"><time datetime="2026-10-31T21:01:25+00:00">October 31, 2026</time></a></div></div>
<div style="height:var(--wp--preset--spacing--20)" aria-hidden="true" class="wp-block-spacer"></div>
</li><li class="wp-block-post post-346 post type-post status-publish format-standard has-post-thumbnail hentry category-design category-nerdy tag-editorial-design-grid tag-indesign-vdp-workflow tag-personalised-print-collateral tag-print-design-uk-studios tag-variable-data-printing-editorial-design-uk">
<div class="wp-block-group is-vertical is-layout-flex wp-container-core-group-is-layout-54d079fe wp-block-group-is-layout-flex"><h3 class="wp-block-post-title has-large-font-size"><a href="https://launchpad-design.co.uk/variable-data-printing-editorial-design-uk-indesign-personalised-collateral/" target="_self" >Print Is Not Dead: How UK Editorial Designers Are Using InDesign and Variable Data Printing to Produce Hyper-Personalised Collateral</a></h3>
<div class="wp-block-post-date has-small-font-size"><a href="https://launchpad-design.co.uk/variable-data-printing-editorial-design-uk-indesign-personalised-collateral/"><time datetime="2026-10-31T17:41:34+00:00">October 31, 2026</time></a></div></div>
<div style="height:var(--wp--preset--spacing--20)" aria-hidden="true" class="wp-block-spacer"></div>
</li><li class="wp-block-post post-344 post type-post status-publish format-standard has-post-thumbnail hentry category-coding category-tech-stuff category-web-design tag-css-scroll-driven-animations tag-frontend-development-uk tag-progressive-enhancement-css tag-scroll-timeline-css tag-web-animation-performance">
<div class="wp-block-group is-vertical is-layout-flex wp-container-core-group-is-layout-54d079fe wp-block-group-is-layout-flex"><h3 class="wp-block-post-title has-large-font-size"><a href="https://launchpad-design.co.uk/css-scroll-driven-animations-production-uk-frontend-developers/" target="_self" >Scroll-Driven Animations in CSS: What UK Frontend Developers Need to Know Before Using Them in Production</a></h3>
<div class="wp-block-post-date has-small-font-size"><a href="https://launchpad-design.co.uk/css-scroll-driven-animations-production-uk-frontend-developers/"><time datetime="2026-10-31T16:01:32+00:00">October 31, 2026</time></a></div></div>
<div style="height:var(--wp--preset--spacing--20)" aria-hidden="true" class="wp-block-spacer"></div>
</li><li class="wp-block-post post-341 post type-post status-publish format-standard has-post-thumbnail hentry category-coding category-tech-stuff category-web-design tag-css-framework-production tag-css-first-configuration tag-frontend-development-uk tag-tailwind-css-v4 tag-tailwind-oxide-engine">
<div class="wp-block-group is-vertical is-layout-flex wp-container-core-group-is-layout-54d079fe wp-block-group-is-layout-flex"><h3 class="wp-block-post-title has-large-font-size"><a href="https://launchpad-design.co.uk/tailwind-css-v4-production-uk-development-teams-real-tradeoffs/" target="_self" >Tailwind CSS v4 in Production: What UK Development Teams Actually Found After Six Months</a></h3>
<div class="wp-block-post-date has-small-font-size"><a href="https://launchpad-design.co.uk/tailwind-css-v4-production-uk-development-teams-real-tradeoffs/"><time datetime="2026-10-31T13:41:33+00:00">October 31, 2026</time></a></div></div>
<div style="height:var(--wp--preset--spacing--20)" aria-hidden="true" class="wp-block-spacer"></div>
</li><li class="wp-block-post post-338 post type-post status-publish format-standard has-post-thumbnail hentry category-coding category-design category-web-design tag-css-custom-properties tag-design-systems tag-design-token-pipeline tag-figma-tokens tag-style-dictionary">
<div class="wp-block-group is-vertical is-layout-flex wp-container-core-group-is-layout-54d079fe wp-block-group-is-layout-flex"><h3 class="wp-block-post-title has-large-font-size"><a href="https://launchpad-design.co.uk/design-token-pipeline-style-dictionary-uk-agency-walkthrough/" target="_self" >Building a Design Token Pipeline With Style Dictionary: A UK Agency’s Practical Walkthrough</a></h3>
<div class="wp-block-post-date has-small-font-size"><a href="https://launchpad-design.co.uk/design-token-pipeline-style-dictionary-uk-agency-walkthrough/"><time datetime="2026-10-31T11:21:43+00:00">October 31, 2026</time></a></div></div>
<div style="height:var(--wp--preset--spacing--20)" aria-hidden="true" class="wp-block-spacer"></div>
</li><li class="wp-block-post post-335 post type-post status-publish format-standard has-post-thumbnail hentry category-design category-nerdy category-web-design tag-freelancer-invoicing-tools-uk tag-invoicing-app-design-uk-freelancers-mtd tag-making-tax-digital-design tag-payment-status-ui-patterns tag-vat-invoice-ui-ux">
<div class="wp-block-group is-vertical is-layout-flex wp-container-core-group-is-layout-54d079fe wp-block-group-is-layout-flex"><h3 class="wp-block-post-title has-large-font-size"><a href="https://launchpad-design.co.uk/invoicing-app-design-uk-freelancers-mtd-vat-hmrc/" target="_self" >Designing Invoicing and Payment Interfaces for UK Freelancers: The VAT, MTD, and HMRC Details That Actually Matter</a></h3>
<div class="wp-block-post-date has-small-font-size"><a href="https://launchpad-design.co.uk/invoicing-app-design-uk-freelancers-mtd-vat-hmrc/"><time datetime="2026-10-31T08:21:37+00:00">October 31, 2026</time></a></div></div>
<div style="height:var(--wp--preset--spacing--20)" aria-hidden="true" class="wp-block-spacer"></div>
</li></ul>
</div>
</div>
</div>
</main>
<footer class="wp-block-template-part">
<div class="wp-block-group alignfull is-style-section-4 has-contrast-color has-base-background-color has-text-color has-background has-link-color wp-elements-5da341d6370005ca50e8ccec8a4d9236 has-global-padding is-layout-constrained wp-container-core-group-is-layout-58f2d333 wp-block-group-is-layout-constrained is-style-section-4--2" style="padding-top:var(--wp--preset--spacing--50);padding-right:var(--wp--preset--spacing--40);padding-bottom:var(--wp--preset--spacing--50);padding-left:var(--wp--preset--spacing--40)">
<div class="wp-block-group alignwide is-content-justification-space-between is-layout-flex wp-container-core-group-is-layout-686a51e3 wp-block-group-is-layout-flex">
<div class="wp-block-group wp-container-content-9cfa9a5a has-global-padding is-content-justification-left is-layout-constrained wp-container-core-group-is-layout-236ffaf5 wp-block-group-is-layout-constrained">
<p class="has-text-align-left wp-block-paragraph" style="font-size:clamp(0.875rem, 0.875rem + ((1vw - 0.2rem) * 0.039), 0.9rem);font-style:normal;font-weight:600;letter-spacing:1px;text-transform:uppercase">Search</p>
<form role="search" method="get" action="https://launchpad-design.co.uk/" class="wp-block-search__button-outside wp-block-search__icon-button wp-block-search" ><label class="wp-block-search__label screen-reader-text" for="wp-block-search__input-3" >Search</label><div class="wp-block-search__inside-wrapper" style="width: 100%"><input class="wp-block-search__input" id="wp-block-search__input-3" placeholder="" value="" type="search" name="s" required style="border-width: 1px"/><button aria-label="Search" class="wp-block-search__button has-background has-icon wp-element-button" type="submit" style="border-width: 1px;background-color: #f3931d"><svg class="search-icon" viewBox="0 0 24 24" width="24" height="24">
<path d="M13 5c-3.3 0-6 2.7-6 6 0 1.4.5 2.7 1.3 3.7l-3.8 3.8 1.1 1.1 3.8-3.8c1 .8 2.3 1.3 3.7 1.3 3.3 0 6-2.7 6-6S16.3 5 13 5zm0 10.5c-2.5 0-4.5-2-4.5-4.5s2-4.5 4.5-4.5 4.5 2 4.5 4.5-2 4.5-4.5 4.5z"></path>
</svg></button></div></form></div>
</div>
<div style="height:48px" aria-hidden="true" class="wp-block-spacer"></div>
<div class="wp-block-group alignwide is-content-justification-space-between is-layout-flex wp-container-core-group-is-layout-1d0a7695 wp-block-group-is-layout-flex">
<div class="wp-block-group is-layout-flex wp-block-group-is-layout-flex"><div class="is-default-size wp-block-site-logo"><a href="https://launchpad-design.co.uk/" class="custom-logo-link" rel="home"><img loading="lazy" width="731" height="279" src="https://launchpad-design.co.uk/wp-content/uploads/2026/01/launchpad_logo.jpg" class="custom-logo" alt="Launchpad Design news and articles" decoding="async" srcset="https://launchpad-design.co.uk/wp-content/uploads/2026/01/launchpad_logo.jpg 731w, https://launchpad-design.co.uk/wp-content/uploads/2026/01/launchpad_logo-300x115.jpg 300w" sizes="auto, (max-width: 731px) 100vw, 731px" /></a></div></div>
</div>
</div>
</footer></div>
<script type="speculationrules">
{"prefetch":[{"source":"document","where":{"and":[{"href_matches":"/*"},{"not":{"href_matches":["/wp-*.php","/wp-admin/*","/wp-content/uploads/*","/wp-content/*","/wp-content/plugins/*","/wp-content/themes/twentytwentyfive/*","/*\\?(.+)"]}},{"not":{"selector_matches":"a[rel~=\"nofollow\"]"}},{"not":{"selector_matches":".no-prefetch, .no-prefetch a"}}]},"eagerness":"conservative"}]}
</script>
<script id="eztoc-scroll-scriptjs-js-extra">
var eztoc_smooth_local = {"scroll_offset":"30","add_request_uri":"","add_self_reference_link":""};
//# sourceURL=eztoc-scroll-scriptjs-js-extra
</script>
<script id="eztoc-scroll-scriptjs-js" src="https://launchpad-design.co.uk/wp-content/plugins/easy-table-of-contents/assets/js/smooth_scroll.min.js?ver=2.0.89"></script>
<script id="eztoc-js-cookie-js" src="https://launchpad-design.co.uk/wp-content/plugins/easy-table-of-contents/vendor/js-cookie/js.cookie.min.js?ver=2.2.1"></script>
<script id="eztoc-jquery-sticky-kit-js" src="https://launchpad-design.co.uk/wp-content/plugins/easy-table-of-contents/vendor/sticky-kit/jquery.sticky-kit.min.js?ver=1.9.2"></script>
<script id="eztoc-js-js-extra">
var ezTOC = {"smooth_scroll":"1","visibility_hide_by_default":"","scroll_offset":"30","fallbackIcon":"\u003Cspan class=\"\"\u003E\u003Cspan class=\"eztoc-hide\" style=\"display:none;\"\u003EToggle\u003C/span\u003E\u003Cspan class=\"ez-toc-icon-toggle-span\"\u003E\u003Csvg style=\"fill: #999;color:#999\" xmlns=\"http://www.w3.org/2000/svg\" class=\"list-377408\" width=\"20px\" height=\"20px\" viewBox=\"0 0 24 24\" fill=\"none\"\u003E\u003Cpath d=\"M6 6H4v2h2V6zm14 0H8v2h12V6zM4 11h2v2H4v-2zm16 0H8v2h12v-2zM4 16h2v2H4v-2zm16 0H8v2h12v-2z\" fill=\"currentColor\"\u003E\u003C/path\u003E\u003C/svg\u003E\u003Csvg style=\"fill: #999;color:#999\" class=\"arrow-unsorted-368013\" xmlns=\"http://www.w3.org/2000/svg\" width=\"10px\" height=\"10px\" viewBox=\"0 0 24 24\" version=\"1.2\" baseProfile=\"tiny\"\u003E\u003Cpath d=\"M18.2 9.3l-6.2-6.3-6.2 6.3c-.2.2-.3.4-.3.7s.1.5.3.7c.2.2.4.3.7.3h11c.3 0 .5-.1.7-.3.2-.2.3-.5.3-.7s-.1-.5-.3-.7zM5.8 14.7l6.2 6.3 6.2-6.3c.2-.2.3-.5.3-.7s-.1-.5-.3-.7c-.2-.2-.4-.3-.7-.3h-11c-.3 0-.5.1-.7.3-.2.2-.3.5-.3.7s.1.5.3.7z\"/\u003E\u003C/svg\u003E\u003C/span\u003E\u003C/span\u003E","chamomile_theme_is_on":""};
//# sourceURL=eztoc-js-js-extra
</script>
<script id="eztoc-js-js" src="https://launchpad-design.co.uk/wp-content/plugins/easy-table-of-contents/assets/js/front.min.js?ver=2.0.89-1792217261"></script>
<script id="wp-emoji-settings" type="application/json">
{"baseUrl":"https://s.w.org/images/core/emoji/17.0.2/72x72/","ext":".png","svgUrl":"https://s.w.org/images/core/emoji/17.0.2/svg/","svgExt":".svg","source":{"concatemoji":"https://launchpad-design.co.uk/wp-includes/js/wp-emoji-release.min.js?ver=7.0.8"}}
</script>
<script type="module">
/*! This file is auto-generated */
var e="script#wp-emoji-settings",t=document.querySelector(e);if(!(t instanceof HTMLScriptElement))throw new Error("Element missing: "+e);const r=JSON.parse(t.text),s=(window._wpemojiSettings=r,"wpEmojiSettingsSupports"),o=["flag","emoji"];function i(e){try{var t={supportTests:e,timestamp:(new Date).valueOf()};sessionStorage.setItem(s,JSON.stringify(t))}catch(e){}}function c(e,t,n){e.clearRect(0,0,e.canvas.width,e.canvas.height),e.fillText(t,0,0);t=new Uint32Array(e.getImageData(0,0,e.canvas.width,e.canvas.height).data);e.clearRect(0,0,e.canvas.width,e.canvas.height),e.fillText(n,0,0);const r=new Uint32Array(e.getImageData(0,0,e.canvas.width,e.canvas.height).data);return t.every((e,t)=>e===r[t])}function p(e,t){e.clearRect(0,0,e.canvas.width,e.canvas.height),e.fillText(t,0,0);var n=e.getImageData(16,16,1,1);for(let e=0;e<n.data.length;e++)if(0!==n.data[e])return!1;return!0}function u(e,t,n,r){switch(t){case"flag":return n(e,"\ud83c\udff3\ufe0f\u200d\u26a7\ufe0f","\ud83c\udff3\ufe0f\u200b\u26a7\ufe0f")?!1:!n(e,"\ud83c\udde8\ud83c\uddf6","\ud83c\udde8\u200b\ud83c\uddf6")&&!n(e,"\ud83c\udff4\udb40\udc67\udb40\udc62\udb40\udc65\udb40\udc6e\udb40\udc67\udb40\udc7f","\ud83c\udff4\u200b\udb40\udc67\u200b\udb40\udc62\u200b\udb40\udc65\u200b\udb40\udc6e\u200b\udb40\udc67\u200b\udb40\udc7f");case"emoji":return!r(e,"\ud83e\u1fac8")}return!1}function f(e,t,n,r){let a;const s=(a="undefined"!=typeof WorkerGlobalScope&&self instanceof WorkerGlobalScope?new OffscreenCanvas(300,150):document.createElement("canvas")).getContext("2d",{willReadFrequently:!0}),o=(s.textBaseline="top",s.font="600 32px Arial",{});return e.forEach(e=>{o[e]=t(s,e,n,r)}),o}function a(e){var t=document.createElement("script");t.src=e,t.defer=!0,document.head.appendChild(t)}r.supports={everything:!0,everythingExceptFlag:!0},new Promise(t=>{let n=function(){try{var e=JSON.parse(sessionStorage.getItem(s));if("object"==typeof e&&"number"==typeof e.timestamp&&(new Date).valueOf()<e.timestamp+604800&&"object"==typeof e.supportTests)return e.supportTests}catch(e){}return null}();if(!n){if("undefined"!=typeof Worker&&"undefined"!=typeof OffscreenCanvas&&"undefined"!=typeof URL&&URL.createObjectURL&&"undefined"!=typeof Blob)try{var e="postMessage("+f.toString()+"("+[JSON.stringify(o),u.toString(),c.toString(),p.toString()].join(",")+"));",r=new Blob([e],{type:"text/javascript"});const a=new Worker(URL.createObjectURL(r),{name:"wpTestEmojiSupports"});return void(a.onmessage=e=>{i(n=e.data),a.terminate(),t(n)})}catch(e){}i(n=f(o,u,c,p))}t(n)}).then(e=>{for(const n in e)r.supports[n]=e[n],r.supports.everything=r.supports.everything&&r.supports[n],"flag"!==n&&(r.supports.everythingExceptFlag=r.supports.everythingExceptFlag&&r.supports[n]);var t;r.supports.everythingExceptFlag=r.supports.everythingExceptFlag&&!r.supports.flag,r.supports.everything||((t=r.source||{}).concatemoji?a(t.concatemoji):t.wpemoji&&t.twemoji&&(a(t.twemoji),a(t.wpemoji)))});
//# sourceURL=https://launchpad-design.co.uk/wp-includes/js/wp-emoji-loader.min.js
</script>
</body>
</html>