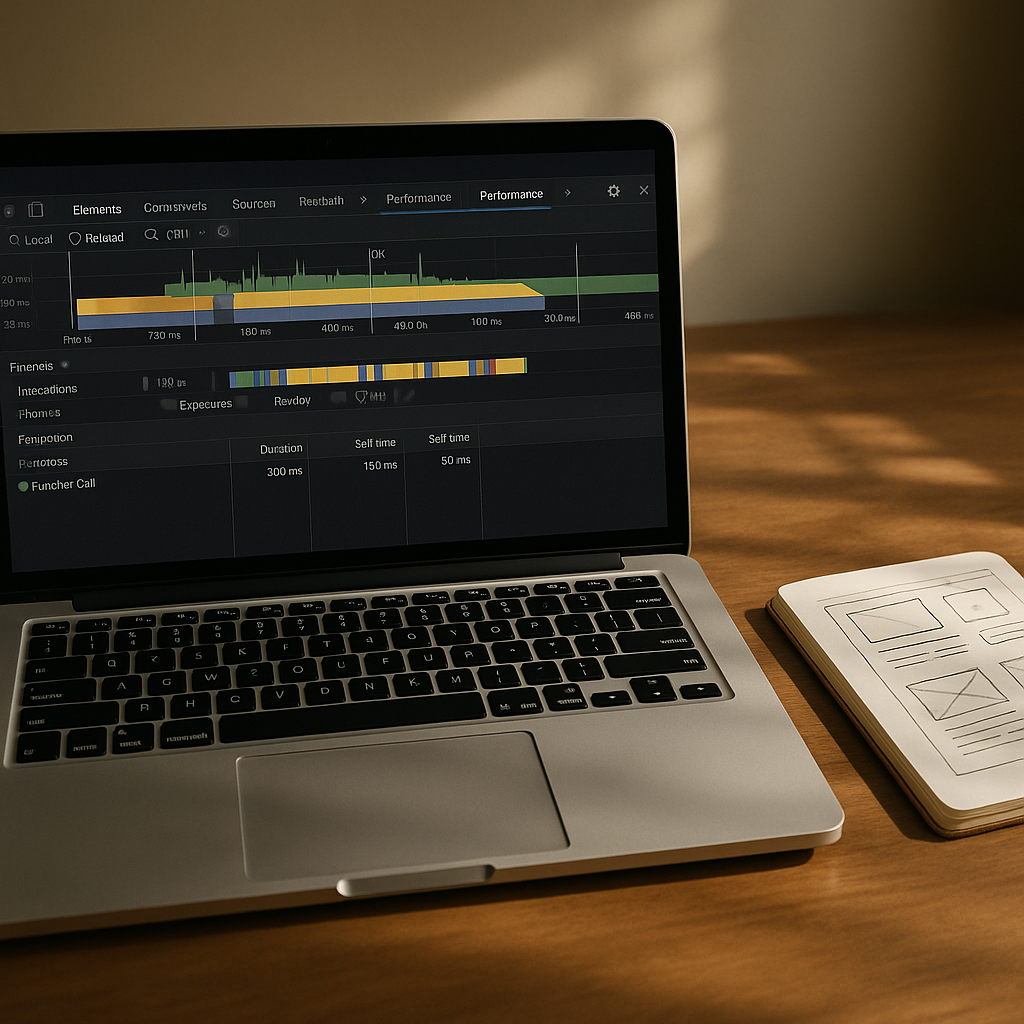
Right. You’ve run PageSpeed Insights, stared at a wall of amber and red scores, and muttered something unprintable at your screen. Welcome to the club. Despite Google making Core Web Vitals a ranking signal years ago, a staggering proportion of UK small business and e-commerce sites are still failing at least one metric. According to the ONS data on UK internet industry, the number of UK businesses trading online continues to grow, which makes it all the more baffling that so many of them are haemorrhaging rankings because of fixable performance issues. This is your technically grounded guide to the core web vitals fix your UK website actually needs in 2026.

What Are Core Web Vitals and Why Do They Still Matter in 2026?
Three metrics. That’s all Google is officially measuring under Core Web Vitals: Largest Contentful Paint (LCP), Interaction to Next Paint (INP), and Cumulative Layout Shift (CLS). INP replaced First Input Delay in early 2024 and it’s been quietly brutalising sites ever since. These aren’t abstract benchmarks invented by committee; they map directly to how a real human being experiences loading a page on a 4G connection on the Tube.
LCP measures how fast your biggest visible element renders. INP measures how snappy your site feels when someone taps, clicks, or types. CLS measures whether your page jumps around like a nervous ferret while it loads. Fail any of them and you’re not just annoying your users; you’re handing a quiet ranking penalty to competitors who bothered to sort theirs out.
Why UK SME and E-Commerce Sites Fail More Than They Should
I’ve looked at a lot of UK business sites over the years and the failure patterns are almost always the same. It’s rarely one catastrophic problem. It’s death by a thousand cuts: a bloated WooCommerce theme, render-blocking Google Tag Manager scripts, hero images served without modern compression, third-party chat widgets loading synchronously. Each one adds a few hundred milliseconds. Collectively they torpedo your LCP.
UK e-commerce sites in particular tend to inherit technical debt from theme marketplaces. Themes built on Bootstrap 4, autoloading twelve Google Fonts variants, carousels powered by jQuery plugins from 2019. The stacking effect is brutal. A site that looks fine on a developer’s M3 MacBook Pro over fibre will absolutely fall apart for someone browsing on an iPhone SE in a post office queue in Wolverhampton.
Fixing LCP: The Largest Contentful Paint Problem
Your LCP target is under 2.5 seconds. Most failing UK sites are sitting between 3.5 and 6 seconds. The biggest culprits are almost always images and render-blocking resources.
Start with your hero image. If it’s a JPEG or PNG being loaded via a CSS background, that’s two problems at once. Switch to WebP or AVIF (AVIF compression is genuinely remarkable at this point), serve it as an <img> element with proper dimensions declared, and add fetchpriority="high" to the tag. That single attribute tells the browser this image is critical and to fetch it immediately rather than queuing it behind other resources.
<img
  src="hero.avif"
  width="1200"
  height="630"
  fetchpriority="high"
  alt="Your descriptive alt text"
>
Next: preload your LCP image in the <head>. This is still criminally underused on UK sites.
<link rel="preload" as="image" href="hero.avif" fetchpriority="high">Finally, audit your render-blocking scripts. Google Tag Manager firing synchronously in the <head> is an LCP killer. Move third-party scripts to load with defer or async wherever possible. GTM itself should load asynchronously; if it isn’t, something has gone wrong with your implementation.
Fixing INP: Interaction to Next Paint Is the Hard One
INP is the metric that’s caught the most sites off-guard since it replaced FID. The threshold for a good score is under 200 milliseconds. Poor is anything over 500ms. The nuance here is that INP measures the worst interaction across an entire page session, not just the first one. That means a sluggish dropdown menu or a heavy on-click handler buried in a product filter can tank your entire score.
The main culprit for high INP on UK e-commerce sites is long tasks on the main thread. JavaScript that runs for more than 50ms without yielding blocks the browser from responding to user input. Here’s the pattern to break it up:
// Instead of one long synchronous function:
function heavyTask() {
  // ...200ms of work...
}

// Yield to the browser between chunks:
async function yieldingTask() {
  for (const chunk of dataChunks) {
    processChunk(chunk);
    await new Promise(resolve => setTimeout(resolve, 0));
  }
}
The scheduler.postTask() API is worth exploring if you’re on a modern stack; it gives you fine-grained control over task priority. For WordPress and WooCommerce sites, the quickest win is usually auditing which plugins are registering event listeners on every page. WooCommerce cart fragments, live chat scripts, cookie consent managers; each one adds JavaScript weight that the browser has to process before it can respond to the next click.
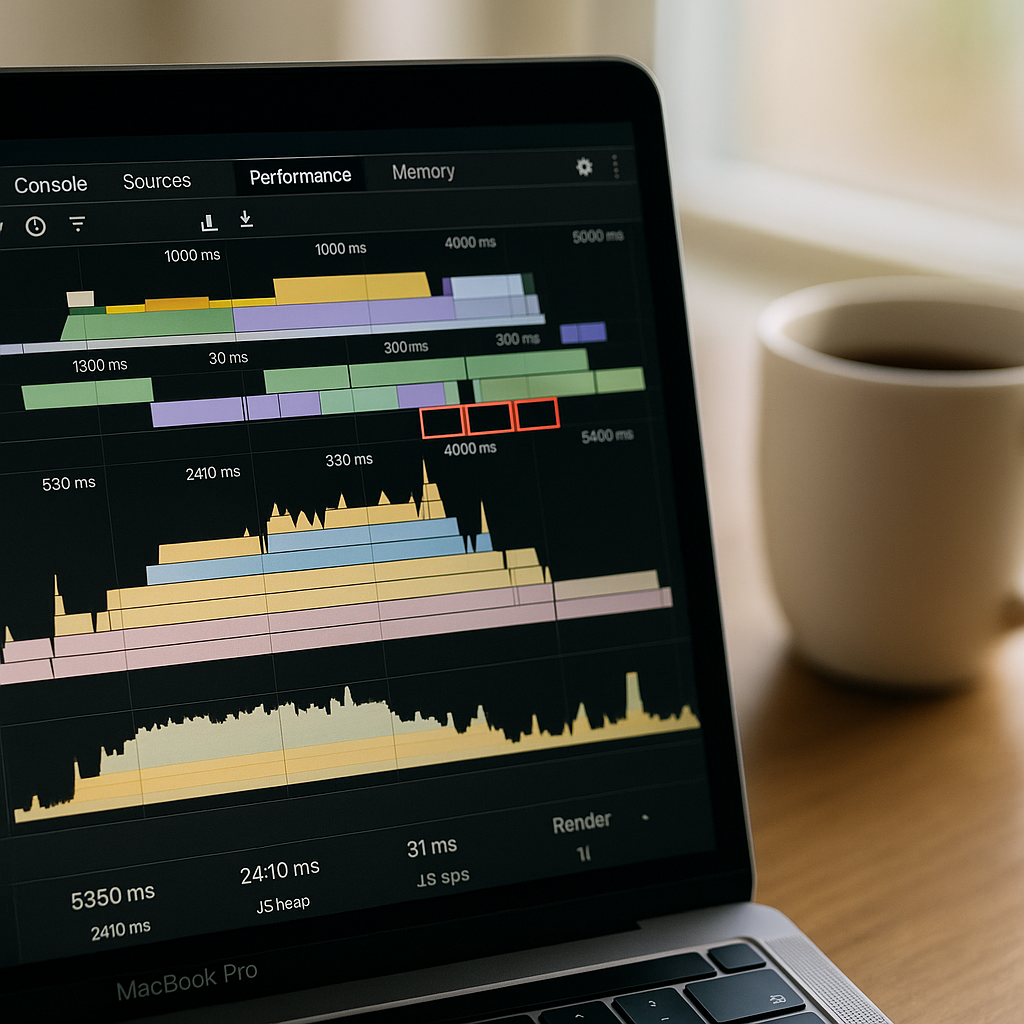
Use Chrome DevTools’ Performance panel (or the slightly more accessible Web Vitals extension) to identify which interactions are generating the longest tasks. Look for the red triangles. Then work backwards to the script responsible.
Fixing CLS: Stop Your Page Jumping Around
Cumulative Layout Shift should be under 0.1. It’s the most visually obvious failure and often the easiest to fix, yet plenty of UK sites are still shipping CLS scores of 0.3 or worse.
The classic cause: images without declared dimensions. When the browser doesn’t know how tall an image is before it loads, it reserves no space. Then the image appears and shunts everything down the page. The fix is a single line of CSS that’s been good practice for years but somehow still gets skipped:
img, video {
  aspect-ratio: attr(width) / attr(height);
  height: auto;
  width: 100%;
}
Always declare explicit width and height attributes on your <img> tags too. The browser uses these to calculate space before the image loads.
Web fonts are the other sneaky CLS source. When your custom font loads and swaps in, text reflows and shifts the layout. The fix is font-display: optional for non-critical fonts, or font-display: swap combined with a closely matched system font fallback using the size-adjust CSS descriptor. The font matching tools from Malte Ubl’s Fontaine project are genuinely useful here for generating fallback metrics automatically.
Ad slots, banners, and dynamically injected content are the third category. Reserve space for them explicitly with CSS. A banner that loads after the DOM has painted and pushes your content down by 60 pixels will absolutely destroy your CLS score.
Measuring the Right Way: Real User Data vs Lab Data
PageSpeed Insights shows you two sets of data: lab data (simulated, consistent, useful for debugging) and field data from the Chrome User Experience Report (CrUX). Google’s ranking decisions are based on CrUX field data, not lab scores. A site can score 95 in PageSpeed lab conditions and still fail Core Web Vitals in the field if real users on real networks and devices are having a different experience.
If your site doesn’t yet have enough traffic to appear in CrUX, you’re assessed at the origin level or not at all. But you should still optimise; you’re building the performance foundation for when the data does accumulate. Use the Google Search Console Core Web Vitals report to see page-group level field data for your actual UK users.
The bottom line for a core web vitals fix on a UK website in 2026 is this: it’s almost never one thing. It’s the compound effect of images, scripts, fonts, and layout choices that were each fine in isolation but terrible together. Audit methodically, fix the highest-impact items first (LCP image delivery and render-blocking scripts will move the needle fastest), and measure with field data, not just lab scores. Your rankings, and your users, will thank you for it.
Frequently Asked Questions
What is a good Core Web Vitals score in 2026?
Google defines ‘good’ as LCP under 2.5 seconds, INP under 200 milliseconds, and CLS under 0.1. All three thresholds need to be met at the 75th percentile of real user page loads to pass. Hitting two out of three still counts as a partial failure.
How do I check my Core Web Vitals for free?
Google Search Console gives you real-user field data grouped by page type, which is the most valuable report for UK site owners. PageSpeed Insights (pagespeed.web.dev) gives you both lab and field data for individual URLs. The Chrome Web Vitals browser extension lets you measure in real time as you browse.
Does fixing Core Web Vitals actually improve Google rankings?
Yes, though it’s one signal among many. Google uses Core Web Vitals as a tiebreaker when content quality is broadly similar between competing pages. For competitive UK e-commerce and local search queries, the difference between a passing and failing score can visibly shift rankings. More importantly, faster sites convert better.
Why is my WordPress site failing INP?
WordPress and WooCommerce sites typically accumulate JavaScript from multiple plugins all registering event listeners and running tasks on the main thread simultaneously. Cart fragment scripts, live chat widgets, cookie consent managers, and page builder scripts are common culprits. Audit your loaded scripts with Chrome DevTools and remove or defer anything not critical to the initial interaction.
How long does it take to fix Core Web Vitals?
Technical fixes can be implemented in a day or two for a developer who knows what they’re looking for. However, Google’s CrUX field data updates on a rolling 28-day window, so you won’t see improvements reflected in Search Console immediately. Expect three to four weeks before field data catches up to your fixes.